
CME GROUP INC. (CME) FY2024 Q3 P&L / Income Statement

Revenue by Product and Service by Derivative Instrument

2024-07-01 to 2024-09-30

Swipe to see the full flow
CME GROUP INC. (CME) FY2024 Q3 P&L / Income StatementIncome statement for 2024-07-01 through 2024-09-30. View: Product and Service by Derivative Instrument. Revenue uses this breakdown; costs and expenses retain the consolidated categories.SOURCESREVENUEOPERATINGPRE-TAXNETClearing and transaction fees - Interest rateClearing and transaction fees - EquitiesClearing and transaction fees - EnergyMarket data and information servicesClearing and transaction fees - Agricultural commodityClearing and transaction fees - MetalClearing and transaction fees - Foreign ExchangeClearing and transaction fees - EBS Foreign ExchangeClearing and transaction fees - BrokerTec Fixed IncomeClearing and transaction fees - Interest Rate SwapOther revenueTotal RevenuesOperating IncomeTotal ExpensesCompensation and benefitsTechnologyAmortization of purchased intangiblesProfessional fees and outside servicesDepreciation and amortizationLicensing and other fee agreementsOther expenseTotal Non-Operating Income (Expense)Income before Income TaxesNet IncomeIncome tax provisionTotal Non-Operating Income (Expense)Total Non-OperatingIncome (Expense)$152.70 MIncome before Income TaxesIncome beforeIncome Taxes$1.18 BTotal RevenuesTotal Revenues$1.58 BOperating IncomeOperating Income$1.02 BClearing and transaction fees - Interest rateClearing and transactionfees - Interest rate$445.80 MNet IncomeNet Income$912.80 MClearing and transaction fees - EquitiesClearing and transactionfees - Equities$291.80 MClearing and transaction fees - EnergyClearing and transactionfees - Energy$204.90 MTotal ExpensesTotal Expenses$560.20 MIncome tax provisionIncome taxes$264.10 MMarket data and information servicesMarket data and information services$178.20 MCompensation and benefitsCompensation and benefits$218.80 MClearing and transaction fees - Agricultural commodityClearing and transactionfees - Agricultural commodity$139.10 MTechnologyTechnology$66.60 MClearing and transaction fees - MetalClearing and transaction fees - Metal$71.80 MAmortization of purchased intangiblesAmortization ofpurchased intangibles$55.70 MClearing and transaction fees - Foreign ExchangeClearing and transactionfees - Foreign Exchange$51.90 MProfessional fees and outside servicesProfessional feesand outside services$31.00 MClearing and transaction fees - EBS Foreign ExchangeClearing and transactionfees - EBS Foreign Exchange$35.20 MDepreciation and amortizationDepreciation and amortization$28.20 MClearing and transaction fees - BrokerTec Fixed IncomeClearing and transaction fees- BrokerTec Fixed Income$33.30 MLicensing and other fee agreementsLicensing and otherfee agreements$97.60 MClearing and transaction fees - Interest Rate SwapClearing and transactionfees - Interest Rate Swap$23.30 MOther expenseOther$62.30 MOther revenueOther$109.10 M
Chart details

CME GROUP INC. (CME) FY2024 Q3 P&L / Income Statement

Income statement for 2024-07-01 through 2024-09-30. View: Product and Service by Derivative Instrument. Revenue uses this breakdown; costs and expenses retain the consolidated categories.

Total Revenues
1,584,400,000 US dollars
Total Expenses
560,200,000 US dollars
Operating Income
1,024,200,000 US dollars
Total Non-Operating Income (Expense)
152,700,000 US dollars
Income before Income Taxes
1,176,900,000 US dollars
Income tax provision
264,100,000 US dollars
Net Income
912,800,000 US dollars
Market data and information services
178,200,000 US dollars
Other revenue
109,100,000 US dollars
Clearing and transaction fees - Agricultural commodity
139,100,000 US dollars
Clearing and transaction fees - BrokerTec Fixed Income
33,300,000 US dollars
Clearing and transaction fees - EBS Foreign Exchange
35,200,000 US dollars
Clearing and transaction fees - Energy
204,900,000 US dollars
Clearing and transaction fees - Equities
291,800,000 US dollars
Clearing and transaction fees - Interest rate
445,800,000 US dollars
Clearing and transaction fees - Metal
71,800,000 US dollars
Clearing and transaction fees - Foreign Exchange
51,900,000 US dollars
Clearing and transaction fees - Interest Rate Swap
23,300,000 US dollars
Compensation and benefits
218,800,000 US dollars
Technology
66,600,000 US dollars
Professional fees and outside services
31,000,000 US dollars
Amortization of purchased intangibles
55,700,000 US dollars
Depreciation and amortization
28,200,000 US dollars
Licensing and other fee agreements
97,600,000 US dollars
Other expense
62,300,000 US dollars

Chart connections

  • Revenue minus operating expenses equals operating income.
  • Operating income plus other income or expense equals income before tax. Income before tax less income tax expense or benefit equals net income.
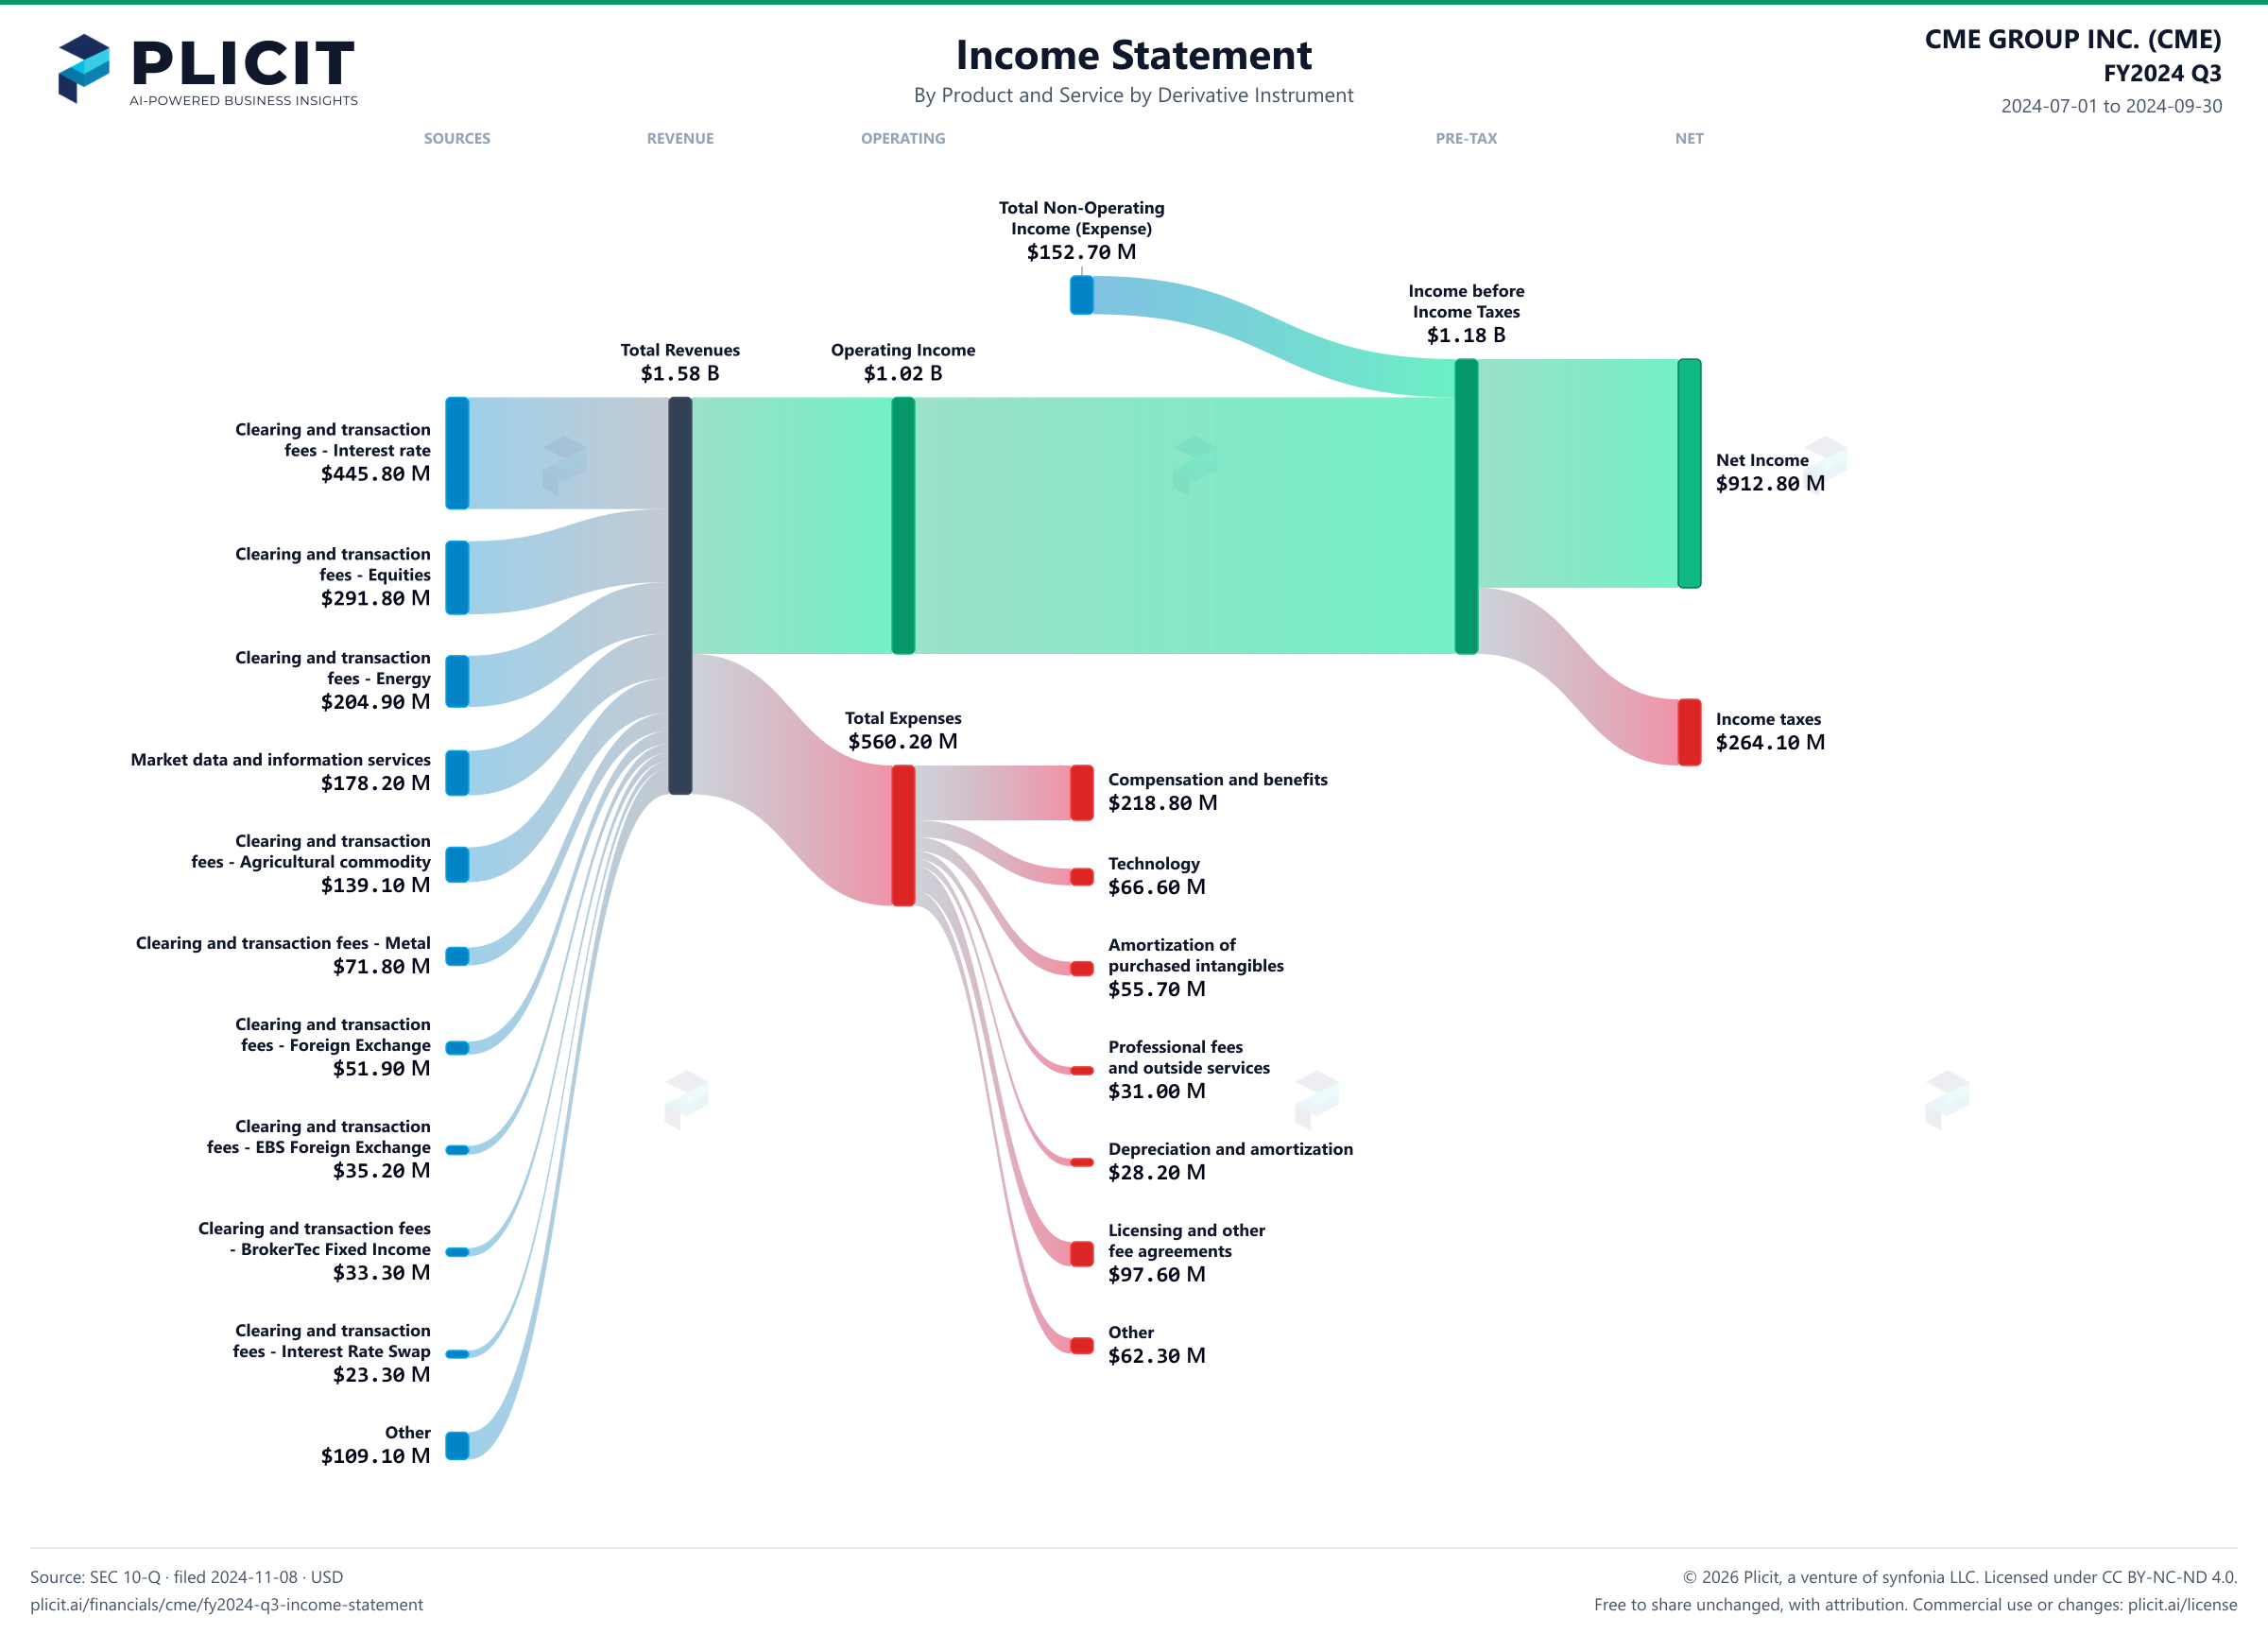
CME GROUP INC. (CME) FY2024 Q3 P&L / Income Statement Sankey chart, Product and service — Product and Service by Derivative Instrument view
Free to share unchanged, with credit to Plicit.ai · CC BY-NC-ND 4.0Download PNG

Operating margin

64.6%

Operating profit / revenue

Cash conversion

109.9%

Operating cash / net income, same period

Newsletter

Get the teardowns by email

Subscribe if you want the public-company teardowns in your inbox when they're released.

Product waitlist

Health Check and Teardown for your own company

A health check uncovers insights of your private books, not a public ticker. Join this list to get notified as soon as we go-live!