
CNA FINANCIAL CORPORATION (CNA) FY2026 Q2 Balance Sheet

Balance Sheet

As of 2026-06-30

Swipe to see the full flow
CNA FINANCIAL CORPORATION (CNA) FY2026 Q2 Balance SheetBalance sheet as of 2026-06-30. The chart shows assets, liabilities and equity at that date.Liabilities$58.69 BAssets$69.87 BEquity$11.19 BGross equity(calculated)$12.52 BHOLDINGSASSETSCLAIM CLASSCLAIM SUB-CLASSCLAIMSFixed maturity securities at fair value (amortized cost of $45,458 and $44,668, less allowance for credit loss of $63 and $69)Reinsurance receivables (less allowance for uncollectible receivables of $27 and $27)Insurance receivables (less allowance for uncollectible receivables of $25 and $25)Deferred non-insurance warranty acquisition expenseLimited partnership investmentsOther assetsShort-term investmentsMortgage loans (less allowance for credit loss of $15 and $15)Deferred acquisition costsEquity securities at fair value (cost of $760 and $728)Deferred income taxesAccrued investment incomeCashProperty and equipment at cost (less accumulated depreciation of $339 and $346)GoodwillOther invested assetsClaim and claim adjustment expensesFuture policy benefitsUnearned premiumsDeferred non-insurance warranty revenueOther liabilities (includes $54 and $54 due to Loews Corporation)Long-term debtRetained earningsAdditional paid-in capitalCommon stock ($2.50 par value; 500,000,000 shares authorized; 273,040,243 shares issued; 270,598,685 and 270,671,747 shares outstanding)AssetsLiabilitiesEquityGross equity (calculated)Accumulated other comprehensive lossTreasury stock (2,441,558 and 2,368,496 shares), at costFixed maturity securities at fair value (amortized cost of $45,458 and $44,668, less allowance for credit loss of $63 and $69)Fixed maturity securities at fair value$43.88 BLiabilitiesLiabilities$58.69 BReinsurance receivables (less allowance for uncollectible receivables of $27 and $27)Reinsurance receivables$6.50 BClaim and claim adjustment expensesClaim and claim adjustment expenses$27.49 BAssetsAssets$69.87 BInsurance receivables (less allowance for uncollectible receivables of $25 and $25)Insurance receivables$4.20 BDeferred non-insurance warranty acquisition expenseDeferred non-insurance warranty acquisition expense$2.98 BFuture policy benefitsFuture policy benefits$13.26 BLimited partnership investmentsLimited partnership investments$2.90 BUnearned premiumsUnearned premiums$8.04 BOther assetsOther assets$2.88 BDeferred non-insurance warranty revenueDeferred non-insurance warranty revenue$3.80 BShort-term investmentsShort-term investments$1.72 BOther liabilities (includes $54 and $54 due to Loews Corporation)Other liabilities$3.13 BMortgage loans (less allowance for credit loss of $15 and $15)Mortgage loans$1.04 BEquityEquity$11.19 BLong-term debtLong-term debt$2.97 BDeferred acquisition costsDeferred acquisition costs$1.03 BGross equity (calculated)Gross equity(calculated)$12.52 BEquity securities at fair value (cost of $760 and $728)Equity securities at fair value (cost of $760 and $728)$793.00 MRetained earningsRetained earnings$9.64 BDeferred income taxesDeferred income taxes$576.00 MAdditional paid-in capitalAdditional paid-in capital$2.20 BAccrued investment incomeAccrued investment income$487.00 MCommon stock ($2.50 par value; 500,000,000 shares authorized; 273,040,243 shares issued; 270,598,685 and 270,671,747 shares outstanding)Common stock$683.00 MCashCash$339.00 MAccumulated other comprehensive lossAccumulated other comprehensive loss−$1.22 BProperty and equipment at cost (less accumulated depreciation of $339 and $346)Property and equipment at cost$291.00 MTreasury stock (2,441,558 and 2,368,496 shares), at costTreasury stock−$117.00 MGoodwillGoodwill$147.00 MOther invested assetsOther invested assets$119.00 M
Chart details

CNA FINANCIAL CORPORATION (CNA) FY2026 Q2 Balance Sheet

Balance sheet as of 2026-06-30. The chart shows assets, liabilities and equity at that date.

Assets
69,874,000,000 US dollars
Liabilities
58,688,000,000 US dollars
Equity
11,186,000,000 US dollars
Fixed maturity securities at fair value (amortized cost of $45,458 and $44,668, less allowance for credit loss of $63 and $69)
43,882,000,000 US dollars
Reinsurance receivables (less allowance for uncollectible receivables of $27 and $27)
6,497,000,000 US dollars
Insurance receivables (less allowance for uncollectible receivables of $25 and $25)
4,199,000,000 US dollars
Deferred non-insurance warranty acquisition expense
2,981,000,000 US dollars
Limited partnership investments
2,904,000,000 US dollars
Other assets
2,875,000,000 US dollars
Short-term investments
1,721,000,000 US dollars
Mortgage loans (less allowance for credit loss of $15 and $15)
1,037,000,000 US dollars
Deferred acquisition costs
1,026,000,000 US dollars
Equity securities at fair value (cost of $760 and $728)
793,000,000 US dollars
Deferred income taxes
576,000,000 US dollars
Accrued investment income
487,000,000 US dollars
Cash
339,000,000 US dollars
Property and equipment at cost (less accumulated depreciation of $339 and $346)
291,000,000 US dollars
Goodwill
147,000,000 US dollars
Other invested assets
119,000,000 US dollars
Claim and claim adjustment expenses
27,490,000,000 US dollars
Future policy benefits
13,262,000,000 US dollars
Unearned premiums
8,035,000,000 US dollars
Deferred non-insurance warranty revenue
3,798,000,000 US dollars
Other liabilities (includes $54 and $54 due to Loews Corporation)
3,130,000,000 US dollars
Long-term debt
2,973,000,000 US dollars
Retained earnings
9,637,000,000 US dollars
Additional paid-in capital
2,199,000,000 US dollars
Common stock ($2.50 par value; 500,000,000 shares authorized; 273,040,243 shares issued; 270,598,685 and 270,671,747 shares outstanding)
683,000,000 US dollars
Accumulated other comprehensive loss
negative 1,216,000,000 US dollars
Treasury stock (2,441,558 and 2,368,496 shares), at cost
negative 117,000,000 US dollars
Gross equity (calculated)
12,519,000,000 US dollars. Net equity plus the magnitudes of its negative contributions equals gross positive equity. The negative contributions enter this reconciliation as add-backs; their filed signs stay negative.

Chart connections

  • Assets equal liabilities plus consolidated equity. Consolidated equity includes noncontrolling interests when reported.
  • Treasury shares and other negative equity contributions reduce equity.
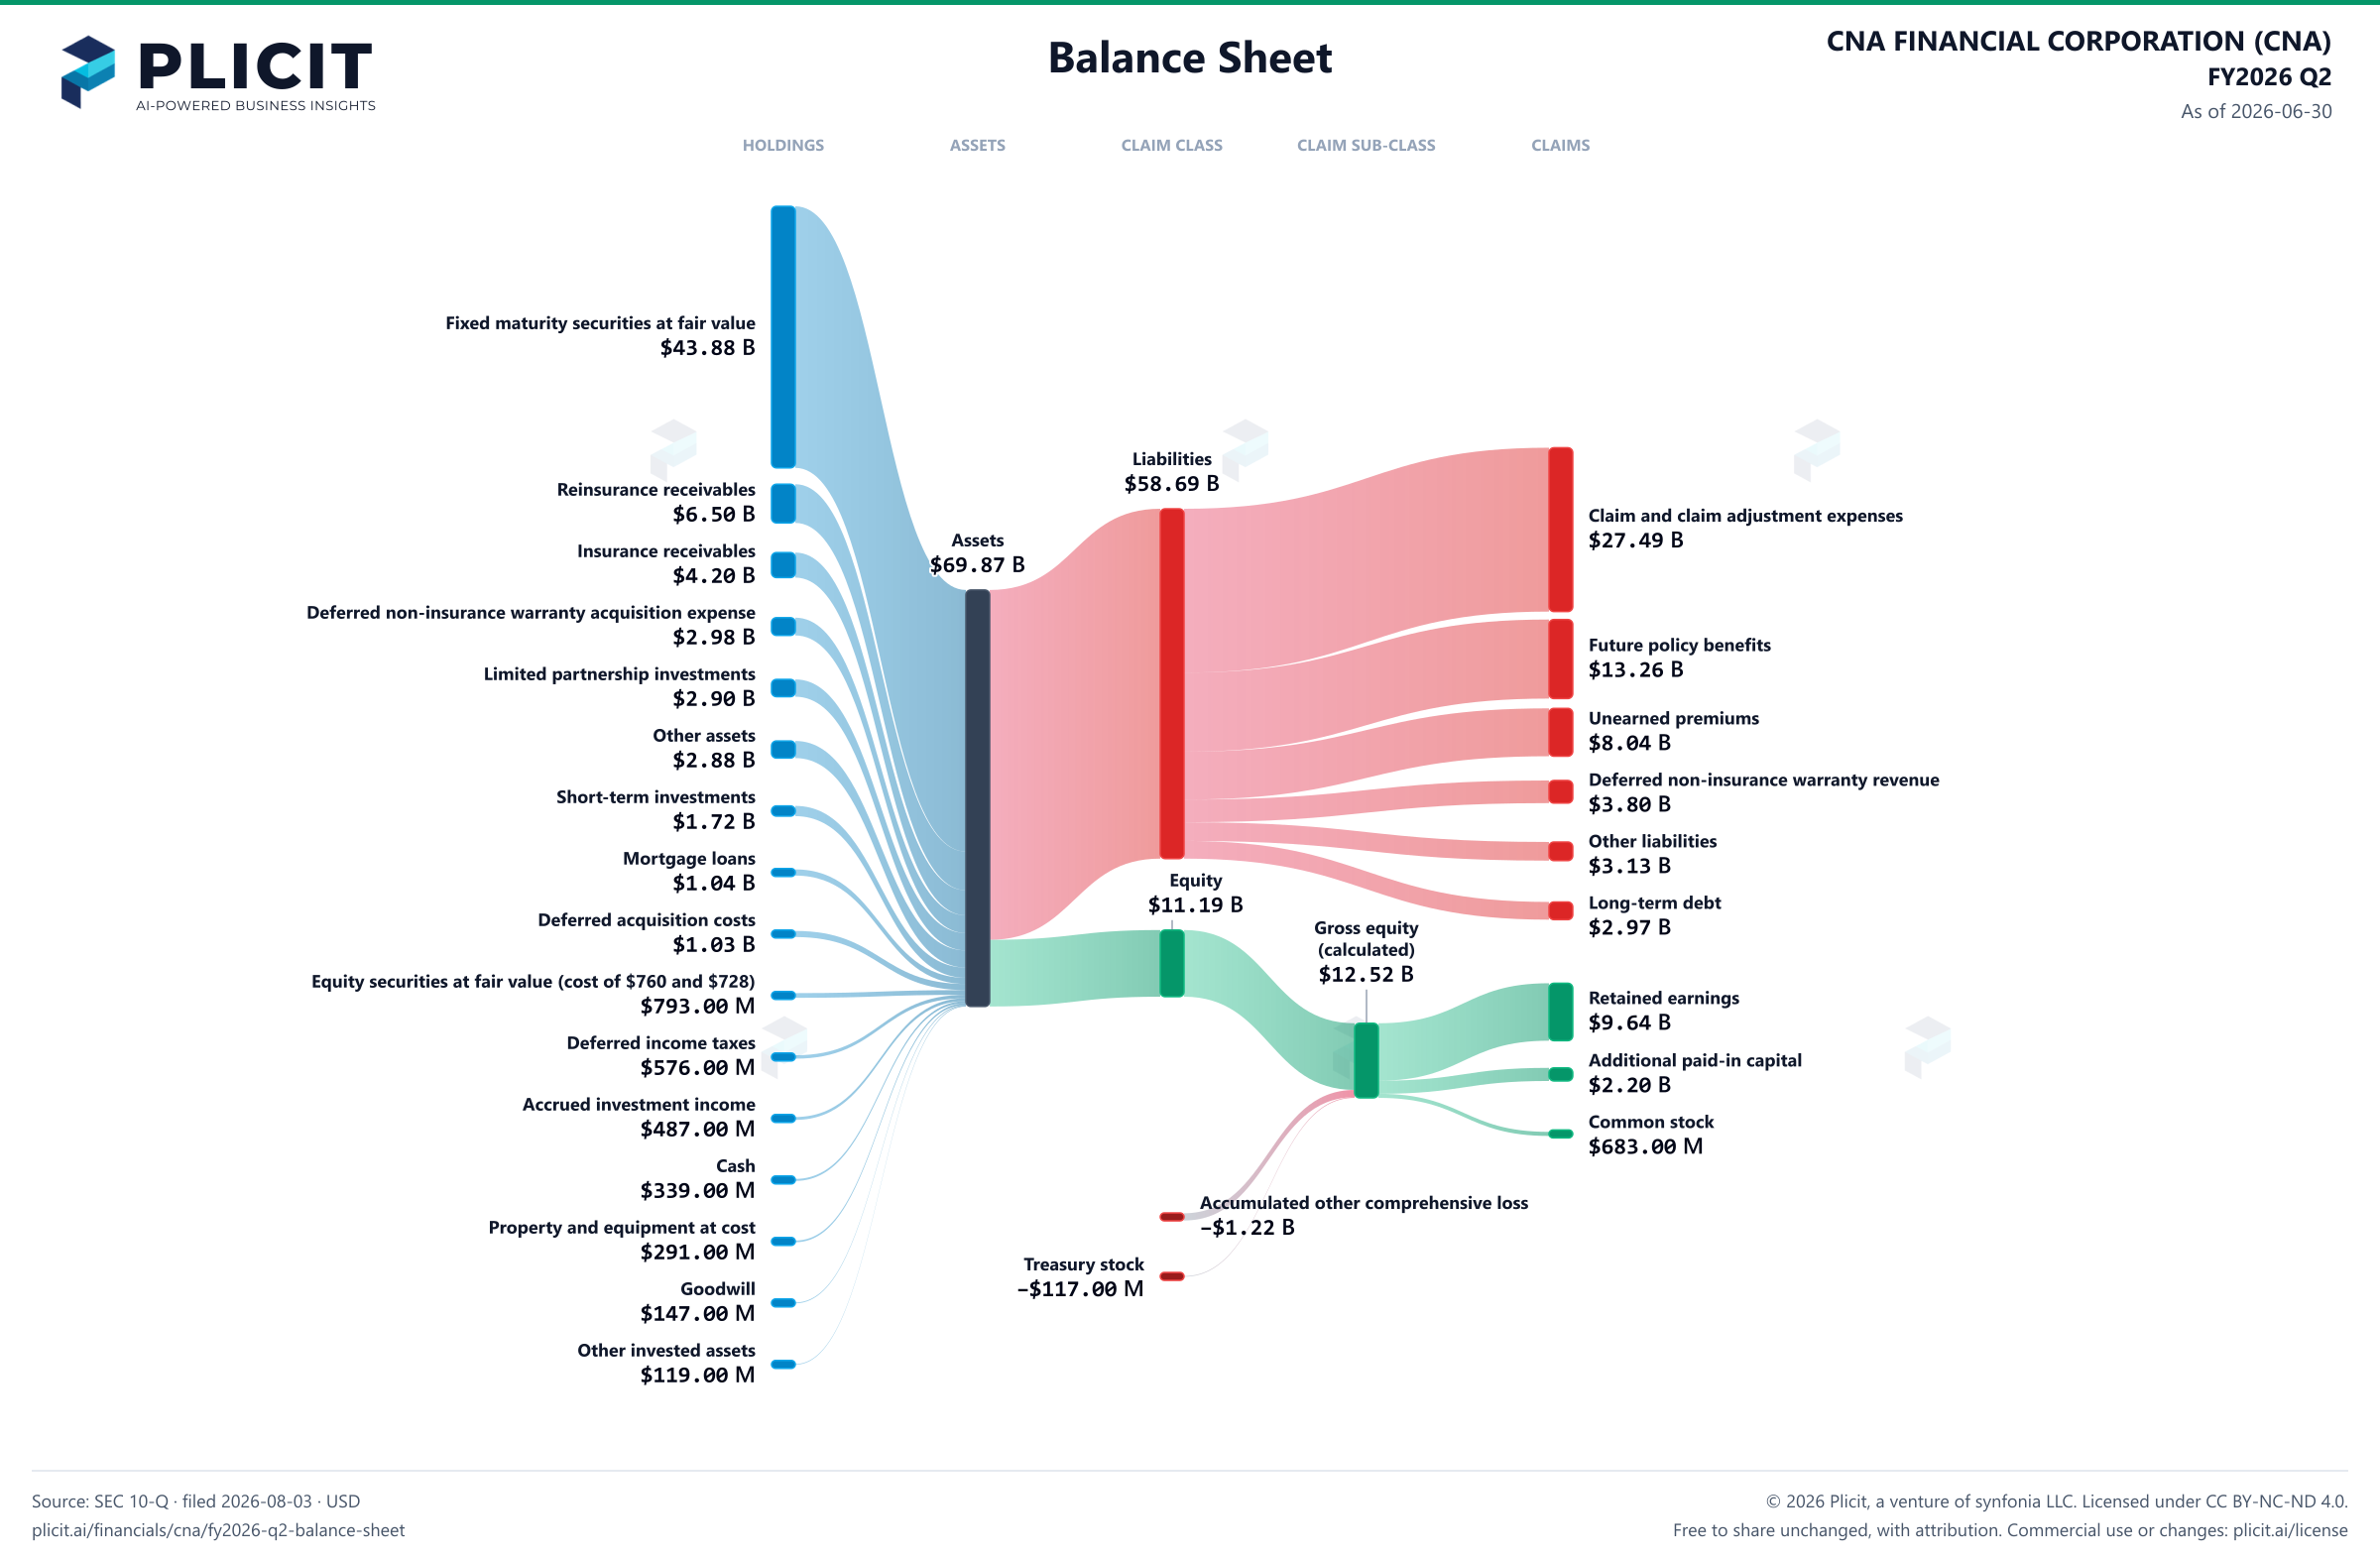
CNA FINANCIAL CORPORATION (CNA) FY2026 Q2 Balance Sheet Sankey chart
Free to share unchanged, with credit to Plicit.ai · CC BY-NC-ND 4.0Download PNG

Newsletter

Get the teardowns by email

Subscribe if you want the public-company teardowns in your inbox when they're released.

Product waitlist

Health Check and Teardown for your own company

A health check uncovers insights of your private books, not a public ticker. Join this list to get notified as soon as we go-live!