
PC CONNECTION, INC. (CNXN) FY2026 Q2 P&L / Income Statement

Revenue by Business Segment by Product and Service

2026-04-01 to 2026-06-30

Swipe to see the full flow
PC CONNECTION, INC. (CNXN) FY2026 Q2 P&L / Income StatementIncome statement for 2026-04-01 through 2026-06-30. View: Segments by Product and Service. Revenue uses this breakdown; costs and expenses retain the consolidated categories.SOURCESREVENUEGROSSOPERATINGPRE-TAXNETBusiness Solutions - Notebooks/MobilityEnterprise Solutions - Notebooks/MobilityPublic Sector Solutions - Notebooks/MobilityEnterprise Solutions - DesktopsEnterprise Solutions - AccessoriesEnterprise Solutions - Displays and SoundBusiness Solutions - SoftwareEnterprise Solutions - SoftwareEnterprise Solutions - Other Hardware/ServicesBusiness Solutions - Net/Com ProductsBusiness Solutions - AccessoriesBusiness Solutions - DesktopsBusiness Solutions - Servers/StorageBusiness Solutions - Displays and SoundEnterprise Solutions - Servers/StorageEnterprise Solutions - Net/Com ProductsBusiness Solutions - Other Hardware/ServicesPublic Sector Solutions - DesktopsPublic Sector Solutions - Displays and SoundPublic Sector Solutions - AccessoriesPublic Sector Solutions - Net/Com ProductsPublic Sector Solutions - SoftwarePublic Sector Solutions - Servers/StoragePublic Sector Solutions - Other Hardware/ServicesNet salesGross profitCost of salesIncome from operationsOperating expenses (calculated)Selling, general and administrative expensesOther income (expense), net (calculated)Income before taxesNet incomeIncome tax provisionOther income (expense), net (calculated)Other income,net (calculated)$2.53 MIncome before taxesIncome before taxes$45.54 MNet salesNet sales$854.00 MGross profitGross profit$157.47 MIncome from operationsIncome from operations$43.01 MNet incomeNet income$33.17 MBusiness Solutions - Notebooks/MobilityBusiness Solutions -Notebooks/Mobility$154.65 MOperating expenses (calculated)Operating expenses(calculated)$114.46 MIncome tax provisionIncome taxes$12.37 MEnterprise Solutions - Notebooks/MobilityEnterprise Solutions- Notebooks/Mobility$123.01 MCost of salesCost of sales$696.52 MSelling, general and administrative expensesSelling, general andadministrative expenses$114.46 MPublic Sector Solutions - Notebooks/MobilityPublic Sector Solutions- Notebooks/Mobility$61.24 MEnterprise Solutions - DesktopsEnterprise Solutions - Desktops$53.22 MEnterprise Solutions - AccessoriesEnterprise Solutions - Accessories$48.38 MEnterprise Solutions - Displays and SoundEnterprise Solutions- Displays and Sound$38.57 MBusiness Solutions - SoftwareBusiness Solutions - Software$38.00 MEnterprise Solutions - SoftwareEnterprise Solutions - Software$31.38 MEnterprise Solutions - Other Hardware/ServicesEnterprise Solutions -Other Hardware/Services$29.62 MBusiness Solutions - Net/Com ProductsBusiness Solutions- Net/Com Products$27.35 MBusiness Solutions - AccessoriesBusiness Solutions - Accessories$26.91 MBusiness Solutions - DesktopsBusiness Solutions - Desktops$26.81 MBusiness Solutions - Servers/StorageBusiness Solutions - Servers/Storage$25.90 MBusiness Solutions - Displays and SoundBusiness Solutions -Displays and Sound$23.90 MEnterprise Solutions - Servers/StorageEnterprise Solutions- Servers/Storage$23.18 MEnterprise Solutions - Net/Com ProductsEnterprise Solutions- Net/Com Products$22.27 MBusiness Solutions - Other Hardware/ServicesBusiness Solutions -Other Hardware/Services$20.35 MPublic Sector Solutions - DesktopsPublic Sector Solutions - Desktops$16.54 MPublic Sector Solutions - Displays and SoundPublic Sector Solutions- Displays and Sound$13.98 MPublic Sector Solutions - AccessoriesPublic Sector Solutions - Accessories$11.53 MPublic Sector Solutions - Net/Com ProductsPublic Sector Solutions- Net/Com Products$11.04 MPublic Sector Solutions - SoftwarePublic Sector Solutions - Software$9.52 MPublic Sector Solutions - Servers/StoragePublic Sector Solutions- Servers/Storage$9.18 MPublic Sector Solutions - Other Hardware/ServicesPublic Sector Solutions -Other Hardware/Services$7.47 M
Chart details

PC CONNECTION, INC. (CNXN) FY2026 Q2 P&L / Income Statement

Income statement for 2026-04-01 through 2026-06-30. View: Segments by Product and Service. Revenue uses this breakdown; costs and expenses retain the consolidated categories.

Net sales
853,996,000 US dollars
Cost of sales
696,523,000 US dollars
Gross profit
157,473,000 US dollars
Operating expenses (calculated)
114,461,000 US dollars
Income from operations
43,012,000 US dollars
Other income (expense), net (calculated)
2,525,000 US dollars
Income before taxes
45,537,000 US dollars
Income tax provision
12,369,000 US dollars
Net income
33,168,000 US dollars
Enterprise Solutions - Accessories
48,381,000 US dollars
Enterprise Solutions - Desktops
53,221,000 US dollars
Enterprise Solutions - Displays and Sound
38,565,000 US dollars
Enterprise Solutions - Net/Com Products
22,272,000 US dollars
Enterprise Solutions - Notebooks/Mobility
123,005,000 US dollars
Enterprise Solutions - Other Hardware/Services
29,619,000 US dollars
Enterprise Solutions - Servers/Storage
23,177,000 US dollars
Enterprise Solutions - Software
31,380,000 US dollars
Public Sector Solutions - Accessories
11,531,000 US dollars
Public Sector Solutions - Desktops
16,541,000 US dollars
Public Sector Solutions - Displays and Sound
13,979,000 US dollars
Public Sector Solutions - Net/Com Products
11,042,000 US dollars
Public Sector Solutions - Notebooks/Mobility
61,240,000 US dollars
Public Sector Solutions - Other Hardware/Services
7,471,000 US dollars
Public Sector Solutions - Servers/Storage
9,178,000 US dollars
Public Sector Solutions - Software
9,524,000 US dollars
Business Solutions - Accessories
26,905,000 US dollars
Business Solutions - Desktops
26,813,000 US dollars
Business Solutions - Displays and Sound
23,896,000 US dollars
Business Solutions - Net/Com Products
27,351,000 US dollars
Business Solutions - Notebooks/Mobility
154,652,000 US dollars
Business Solutions - Other Hardware/Services
20,352,000 US dollars
Business Solutions - Servers/Storage
25,900,000 US dollars
Business Solutions - Software
38,001,000 US dollars
Selling, general and administrative expenses
114,461,000 US dollars

Chart connections

  • Revenue less cost of revenue equals gross profit; gross profit less operating expenses equals operating income.
  • Operating income plus other income or expense equals income before tax. Income before tax less income tax expense or benefit equals net income.
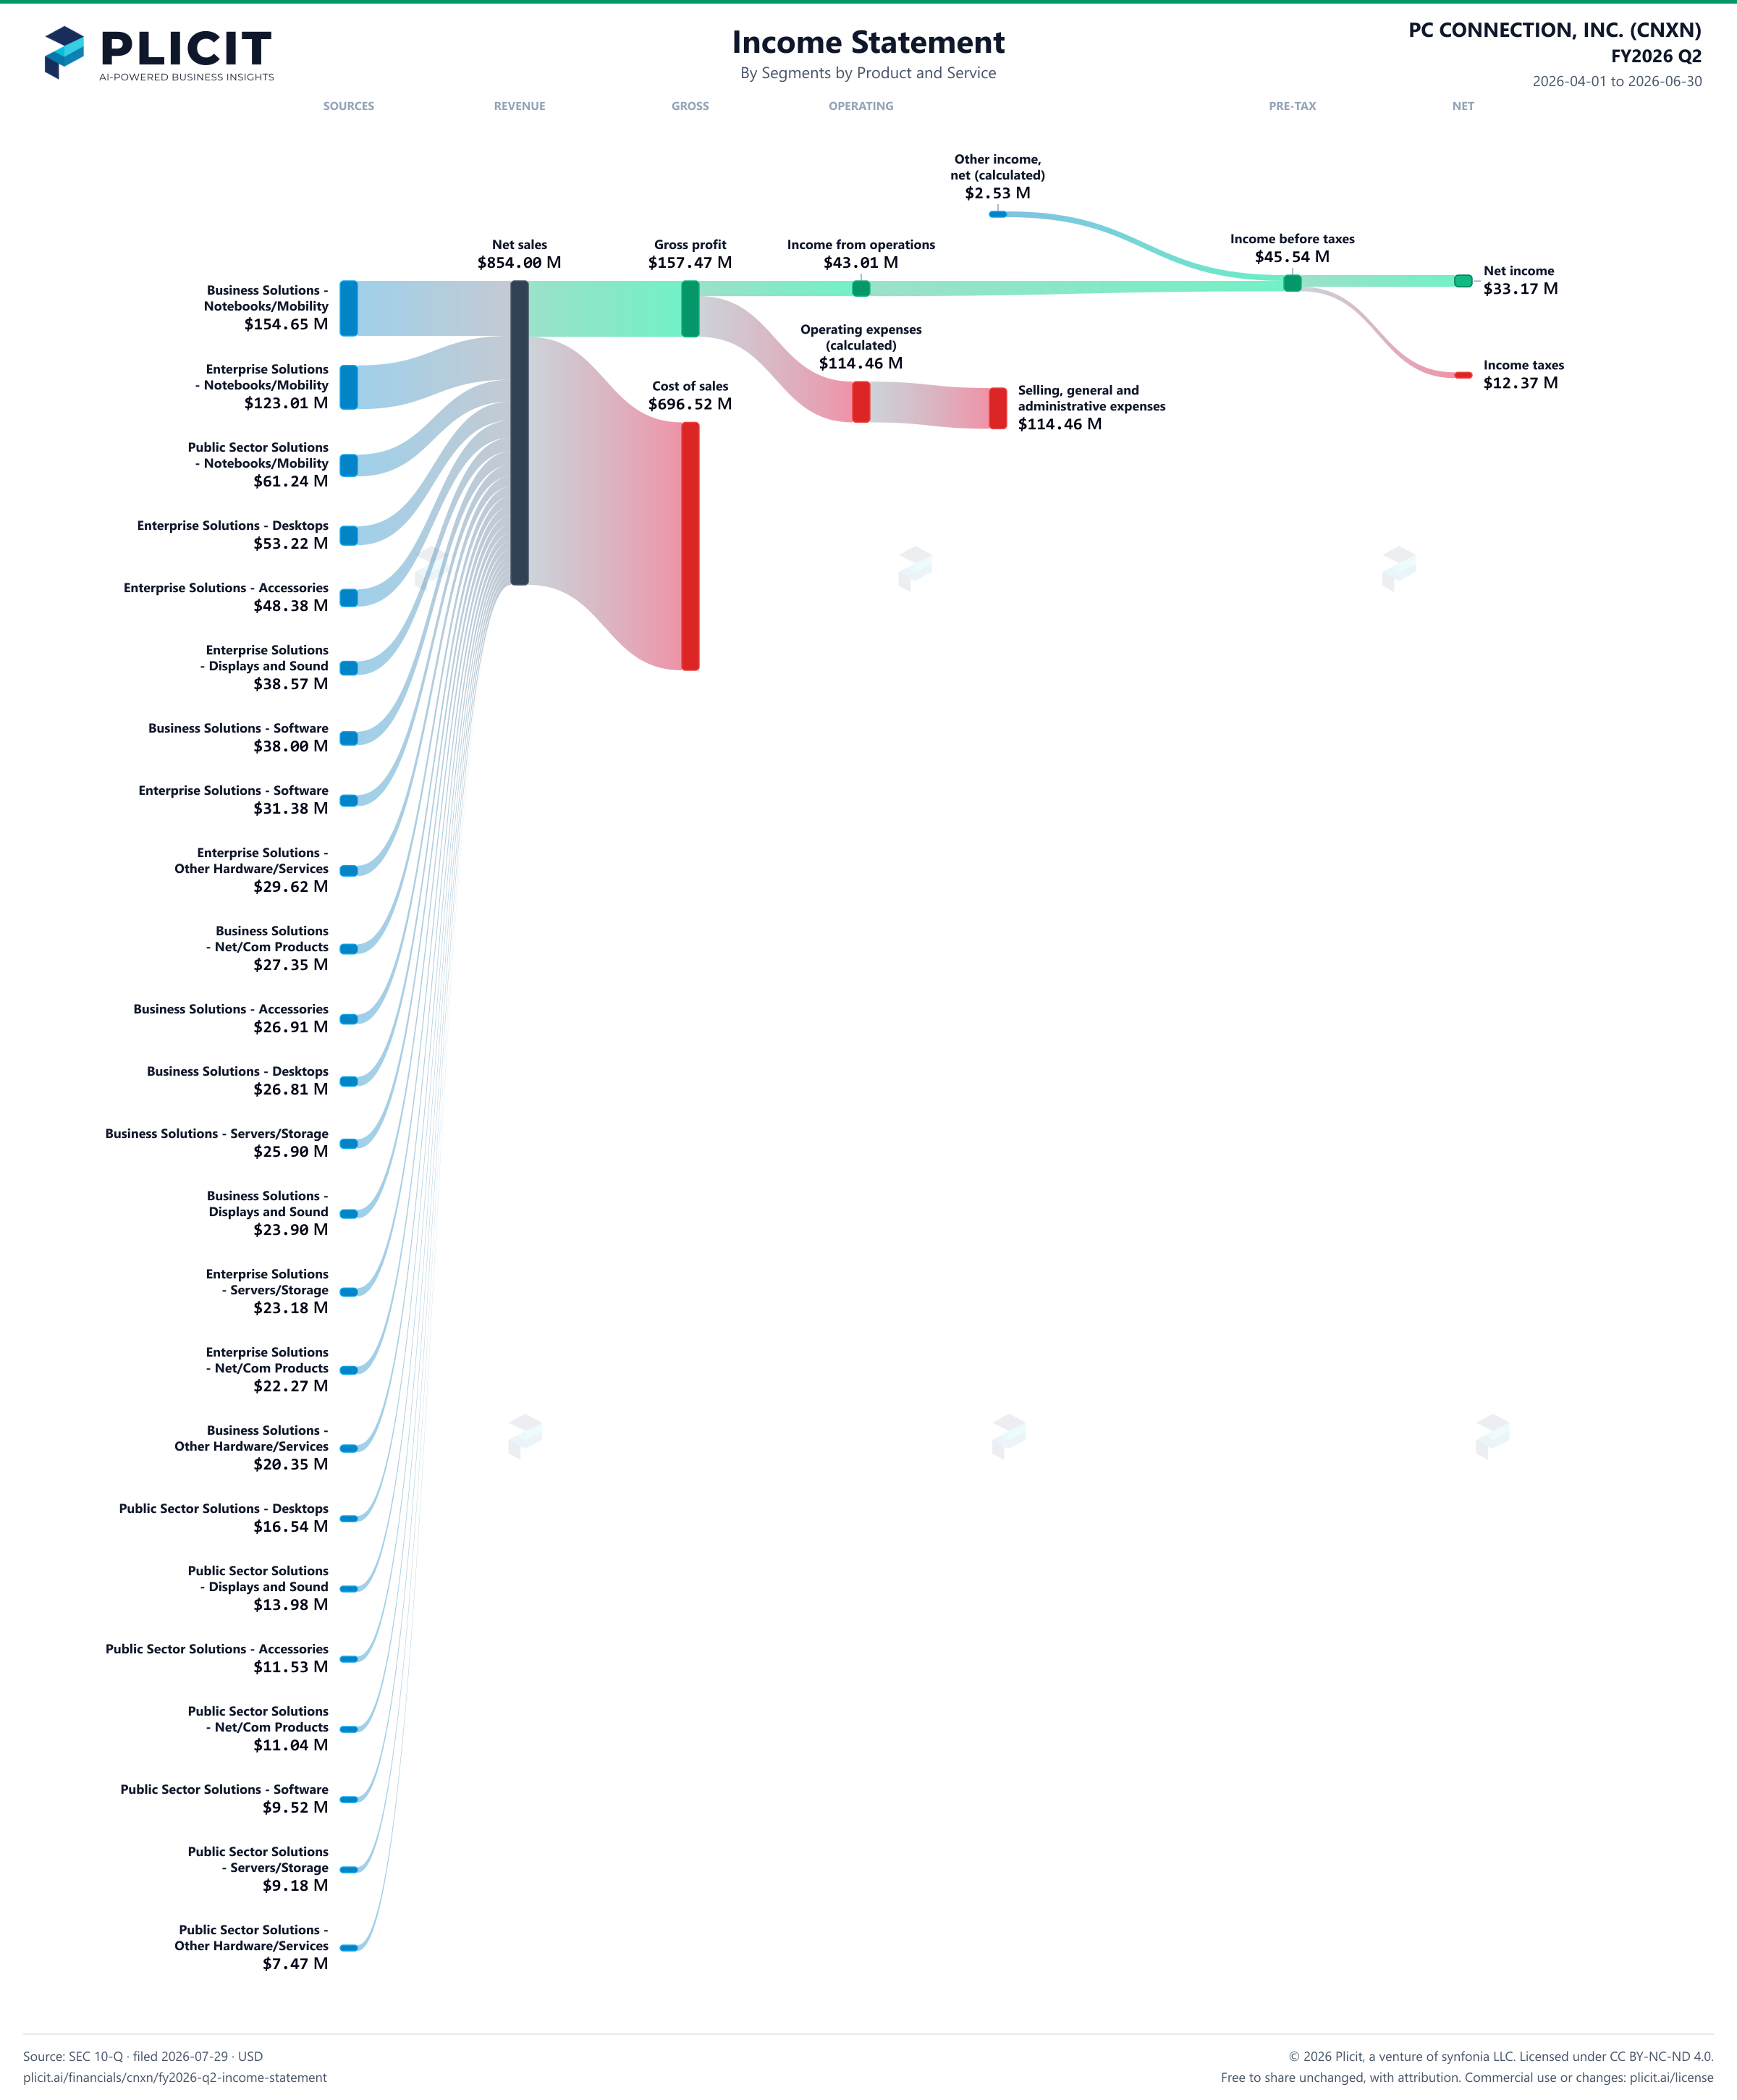
PC CONNECTION, INC. (CNXN) FY2026 Q2 Revenue by Business Segment by Product and Service Sankey chart
Free to share unchanged, with credit to Plicit.ai · CC BY-NC-ND 4.0Download PNG

Gross margin

18.4%

Gross profit / revenue

Operating margin

5.0%

Operating profit / revenue

Cash conversion

−192.4%

Operating cash / net income, same period

Newsletter

Get the teardowns by email

Subscribe if you want the public-company teardowns in your inbox when they're released.

Product waitlist

Health Check and Teardown for your own company

A health check uncovers insights of your private books, not a public ticker. Join this list to get notified as soon as we go-live!