
Core Scientific, Inc./tx (CORZ) FY2026 Q2 Statement of Cash Flows
2026-04-01 to 2026-06-30
Statement of Cash Flows
2026-04-01 to 2026-06-30
Swipe to see the full flow
Chart details
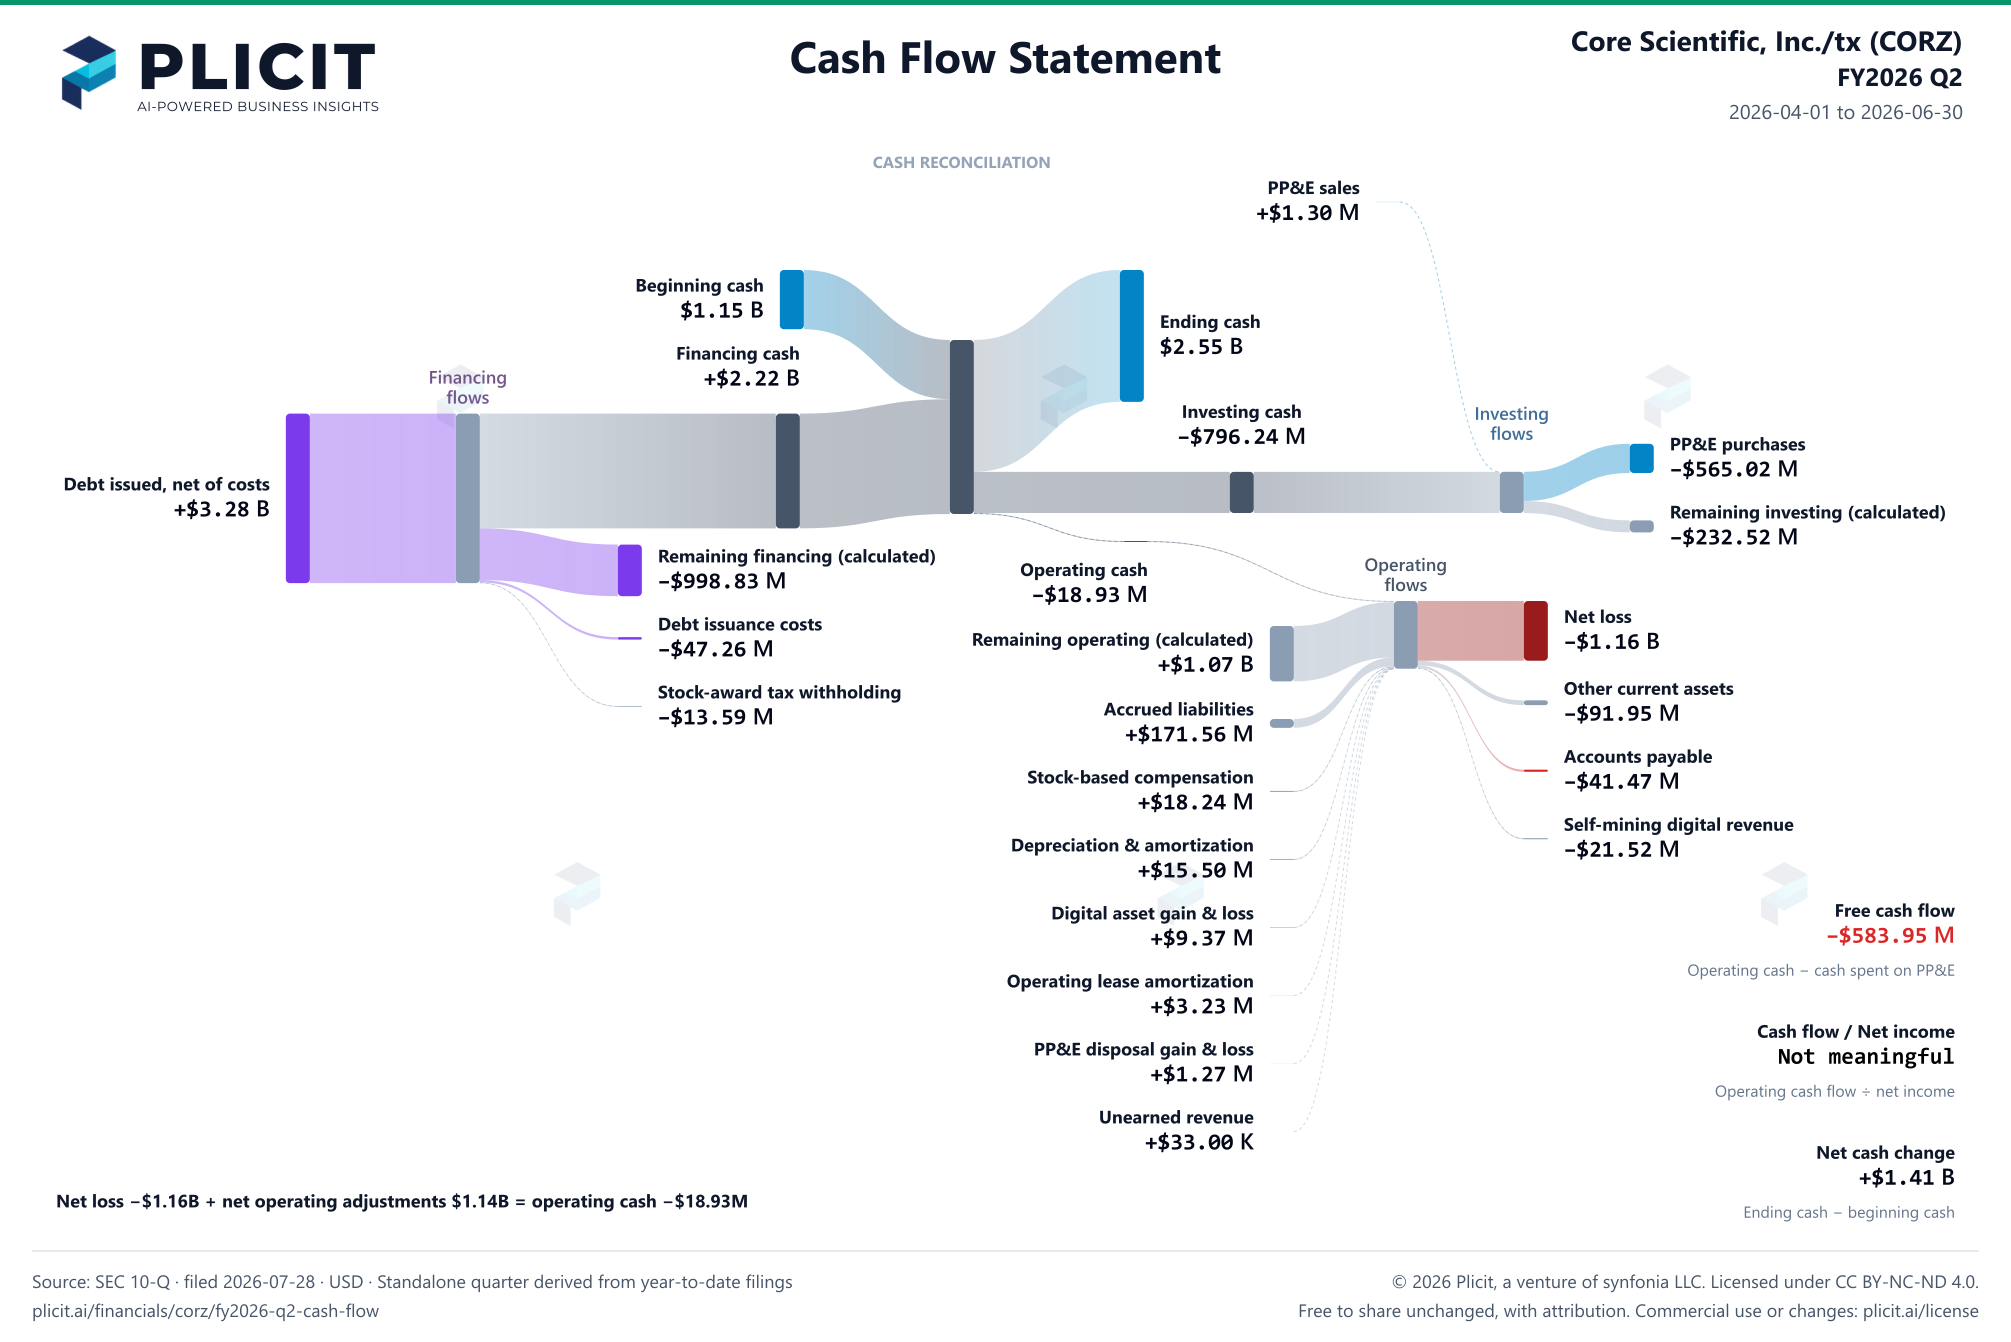
Core Scientific, Inc./tx cash flow reconciliation, Apr 1, 2026 through Jun 30, 2026
Cash flows for Apr 1, 2026 through Jun 30, 2026. Cash basis: Cash, cash equivalents, and restricted cash. Beginning cash: Mar 31, 2026. Ending cash: Jun 30, 2026. Beginning and ending cash are dated balances. Positive cash flows add cash; negative cash flows reduce it.
- Beginning cash on Mar 31, 2026
- 1,145,985,000 US dollars. Beginning cash: Cash, cash equivalents, and restricted cash
- Operating activities
- negative 18,928,000 US dollars. Net cash used. The remaining amount is calculated by subtracting the other displayed items from the operating total. This quarter is the year to date less the prior quarter's year to date. The prior quarter reported part of this section under different lines (Change in fair value of contingent value rights, Amortization of debt discount, Change in fair value of warrant liabilities, Deferred revenue from services, Other noncurrent assets and liabilities, net and Impairment of property, plant and equipment), so Change in fair value of warrants and contingent value rights, Loss on remeasurement of assets held for sale, Loss on debt extinguishment, Impairment of property, plant and equipment and Other operating assets and liabilities, net cannot be separated for this quarter. It may combine inflows and outflows.
- Net loss
- negative 1,155,310,000 US dollars
- Depreciation and amortization
- 15,498,000 US dollars
- Loss on disposal of property, plant and equipment
- 1,273,000 US dollars
- Change in operating lease right-of-use assets
- 3,231,000 US dollars
- Stock-based compensation
- 18,240,000 US dollars
- Digital asset self-mining revenue
- negative 21,521,000 US dollars
- Proceeds from sales of digital assets generated by self-mining revenues
- 0 US dollars
- Loss (gain) on fair value of digital assets
- 9,368,000 US dollars
- Customer funding receivable and other current assets
- negative 91,949,000 US dollars
- Accounts payable
- negative 41,468,000 US dollars
- Accrued expenses
- 171,561,000 US dollars
- Deferred revenue from colocation services
- 33,000 US dollars
- Remaining operating cash flows, net (calculated)
- 1,072,116,000 US dollars
- Investing activities
- negative 796,239,000 US dollars. Net cash used. The remaining amount is calculated by subtracting the other displayed items from the investing total. This quarter is the year to date less the prior quarter's year to date. The prior quarter reported part of this section under different lines (Investments in intangible assets), so Other investing activities and Acquisitions of land and development rights cannot be separated for this quarter. It may combine inflows and outflows.
- Purchases of property, plant and equipment
- negative 565,018,000 US dollars
- Proceeds from sales of property and equipment
- 1,298,000 US dollars
- Remaining investing cash flows, net (calculated)
- negative 232,519,000 US dollars
- Financing activities
- 2,220,573,000 US dollars. Net cash provided. The remaining amount is calculated by subtracting the other displayed items from the financing total. This quarter is the year to date less the prior quarter's year to date. The prior quarter reported part of this section under different lines (Principal repayments of finance leases and Proceeds from exercise of warrants), so Debt extinguishment payments and Other financing activities cannot be separated for this quarter. It may combine inflows and outflows.
- Proceeds from the issuance of debt
- 3,280,250,000 US dollars
- Debt issuance costs
- negative 47,261,000 US dollars
- Taxes paid related to net share settlement of equity awards
- negative 13,588,000 US dollars
- Principal payments on debt
- 0 US dollars
- Remaining financing cash flows, net (calculated)
- negative 998,828,000 US dollars
- Operating adjustment reconciliation
- 1,310,248,000 US dollars. Intermediate calculation joining the displayed items and the calculated net remainder. It does not establish gross cash receipts or payments and is not an additional cash flow.
- financing displayed reconciliation
- 3,280,250,000 US dollars. Intermediate calculation joining the displayed items and the calculated net remainder. It does not establish gross cash receipts or payments and is not an additional cash flow.
- investing displayed reconciliation
- 797,537,000 US dollars. Intermediate calculation joining the displayed items and the calculated net remainder. It does not establish gross cash receipts or payments and is not an additional cash flow.
- Exchange-rate effect
- 0 US dollars
- Ending cash on Jun 30, 2026
- 2,551,391,000 US dollars. Ending cash: Cash, cash equivalents, and restricted cash
- Cash sources and uses
- 3,366,558,000 US dollars. Opening cash plus net sources, equal to net uses plus ending cash.
- Net cash change
- 1,405,406,000 US dollars. Ending cash minus beginning cash.
- Cash flow / Net income
- Not meaningful. Operating cash flow divided by reconciliation net income for the same period. The ratio is not meaningful when net income is zero or negative.
- Operating cash flow
- negative 18,928,000 US dollars. Operating cash flow used in the free cash flow calculation.
- Cash purchases of property, plant and equipment
- 565,018,000 US dollars. These cash purchases are already included in investing activities above.
- Free cash flow
- negative 583,946,000 US dollars. A supplemental measure; finance-lease payments are excluded from this definition.
Chart connections
- Beginning cash plus operating, investing and financing cash flows plus the exchange-rate effect equals ending cash. Negative amounts reduce cash.
- Financing contributions meet at a reconciliation junction before connecting to the net cash total.
- Investing contributions meet at a reconciliation junction before connecting to the net cash total.
- Operating reconciliation adjustments are not all independent cash receipts.
- Net loss −$1.16B + net operating adjustments $1.14B = operating cash −$18.93M. The loss reduces the earnings basis of the reconciliation; it is not a cash payment. The signed loss remains a deduction at the operating reconciliation junction.
- Each activity has one net cash bar connected to the shared cash pool. Positive activity totals enter the pool; negative activity totals leave the pool to fund that activity's net payments. The central pool does not assign a particular funding source to a particular payment.
- The intermediate calculation bars include both sides of the displayed activity breakdowns; they are not additional cash flows.
- Operating cash flow minus cash purchases of property, plant and equipment equals free cash flow: negative 18,928,000 US dollars minus 565,018,000 US dollars equals negative 583,946,000 US dollars.
Free to share unchanged, with credit to Plicit.ai · CC BY-NC-ND 4.0Download PNG
Product waitlist
Health Check and Teardown for your own company
A health check uncovers insights of your private books, not a public ticker. Join this list to get notified as soon as we go-live!