
Core Scientific, Inc./tx (CORZ) FY2026 YTD Q2 P&L / Income Statement

Revenue by Product and Service

2026-01-01 to 2026-06-30

Swipe to see the full flow
Core Scientific, Inc./tx (CORZ) FY2026 YTD Q2 P&L / Income StatementIncome statement for 2026-01-01 through 2026-06-30. View: Revenue categories. Revenue uses this breakdown; costs and expenses retain the consolidated categories.SOURCESREVENUEGROSSOPERATINGPRE-TAXNETColocation revenueDigital asset self-mining revenueDigital asset hosted mining revenue from customersTotal revenueGross profitTotal cost of revenueOperating lossOperating costs, including other operating expenses (calculated)Impairment of property, plant and equipmentSelling, general and administrativeLoss on contract terminationColocation organizational and site startup costsLoss on remeasurement of assets held for saleLoss (gain) on fair value of digital assetsLoss on disposal of property, plant and equipmentLoss before income taxesTotal non-operating expense, netNet lossIncome tax expenseLoss before income taxesLoss beforeincome taxes−$1.50 BTotal revenueTotal revenue$279.45 MGross profitGross profit$100.15 MOperating lossOperating loss−$388.89 MColocation revenueColocation revenue$214.21 MTotal cost of revenueTotal cost of revenue$179.30 MDigital asset self-mining revenueDigital asset self-mining revenue$51.64 MOperating costs, including other operating expenses (calculated)Operating costs(calculated)$489.04 MDigital asset hosted mining revenue from customersDigital asset hosted miningrevenue from customers$13.60 MNet lossNet loss−$1.50 BImpairment of property, plant and equipmentImpairment of property,plant and equipment$266.49 MSelling, general and administrativeSelling, general and administrative$94.57 MLoss on contract terminationLoss on contract termination$41.95 MColocation organizational and site startup costsColocation organizationaland site startup costs$35.70 MIncome tax expenseIncome tax expense$2.51 MLoss on remeasurement of assets held for saleLoss on remeasurementof assets held for sale$19.50 MLoss (gain) on fair value of digital assetsLoss (gain) on fairvalue of digital assets$15.93 MTotal non-operating expense, netTotal non-operatingexpense, net−$1.11 BLoss on disposal of property, plant and equipmentLoss on disposal of property,plant and equipment$14.91 M
Chart details

Core Scientific, Inc./tx (CORZ) FY2026 YTD Q2 P&L / Income Statement

Income statement for 2026-01-01 through 2026-06-30. View: Revenue categories. Revenue uses this breakdown; costs and expenses retain the consolidated categories.

Total revenue
279,445,000 US dollars
Total cost of revenue
179,295,000 US dollars
Gross profit
100,150,000 US dollars
Operating costs, including other operating expenses (calculated)
489,040,000 US dollars
Operating loss
negative 388,890,000 US dollars
Total non-operating expense, net
negative 1,111,101,000 US dollars
Loss before income taxes
negative 1,499,991,000 US dollars
Income tax expense
2,507,000 US dollars
Net loss
negative 1,502,498,000 US dollars
Colocation revenue
214,208,000 US dollars
Digital asset hosted mining revenue from customers
13,597,000 US dollars
Digital asset self-mining revenue
51,640,000 US dollars
Loss on remeasurement of assets held for sale
19,495,000 US dollars
Impairment of property, plant and equipment
266,488,000 US dollars
Colocation organizational and site startup costs
35,704,000 US dollars
Selling, general and administrative
94,568,000 US dollars
Loss (gain) on fair value of digital assets
15,926,000 US dollars
Loss on disposal of property, plant and equipment
14,911,000 US dollars
Loss on contract termination
41,948,000 US dollars

Chart connections

  • Revenue less cost of revenue equals gross profit; gross profit less operating expenses equals operating income.
  • Operating income plus other income or expense equals income before tax. Income before tax less income tax expense or benefit equals net income.
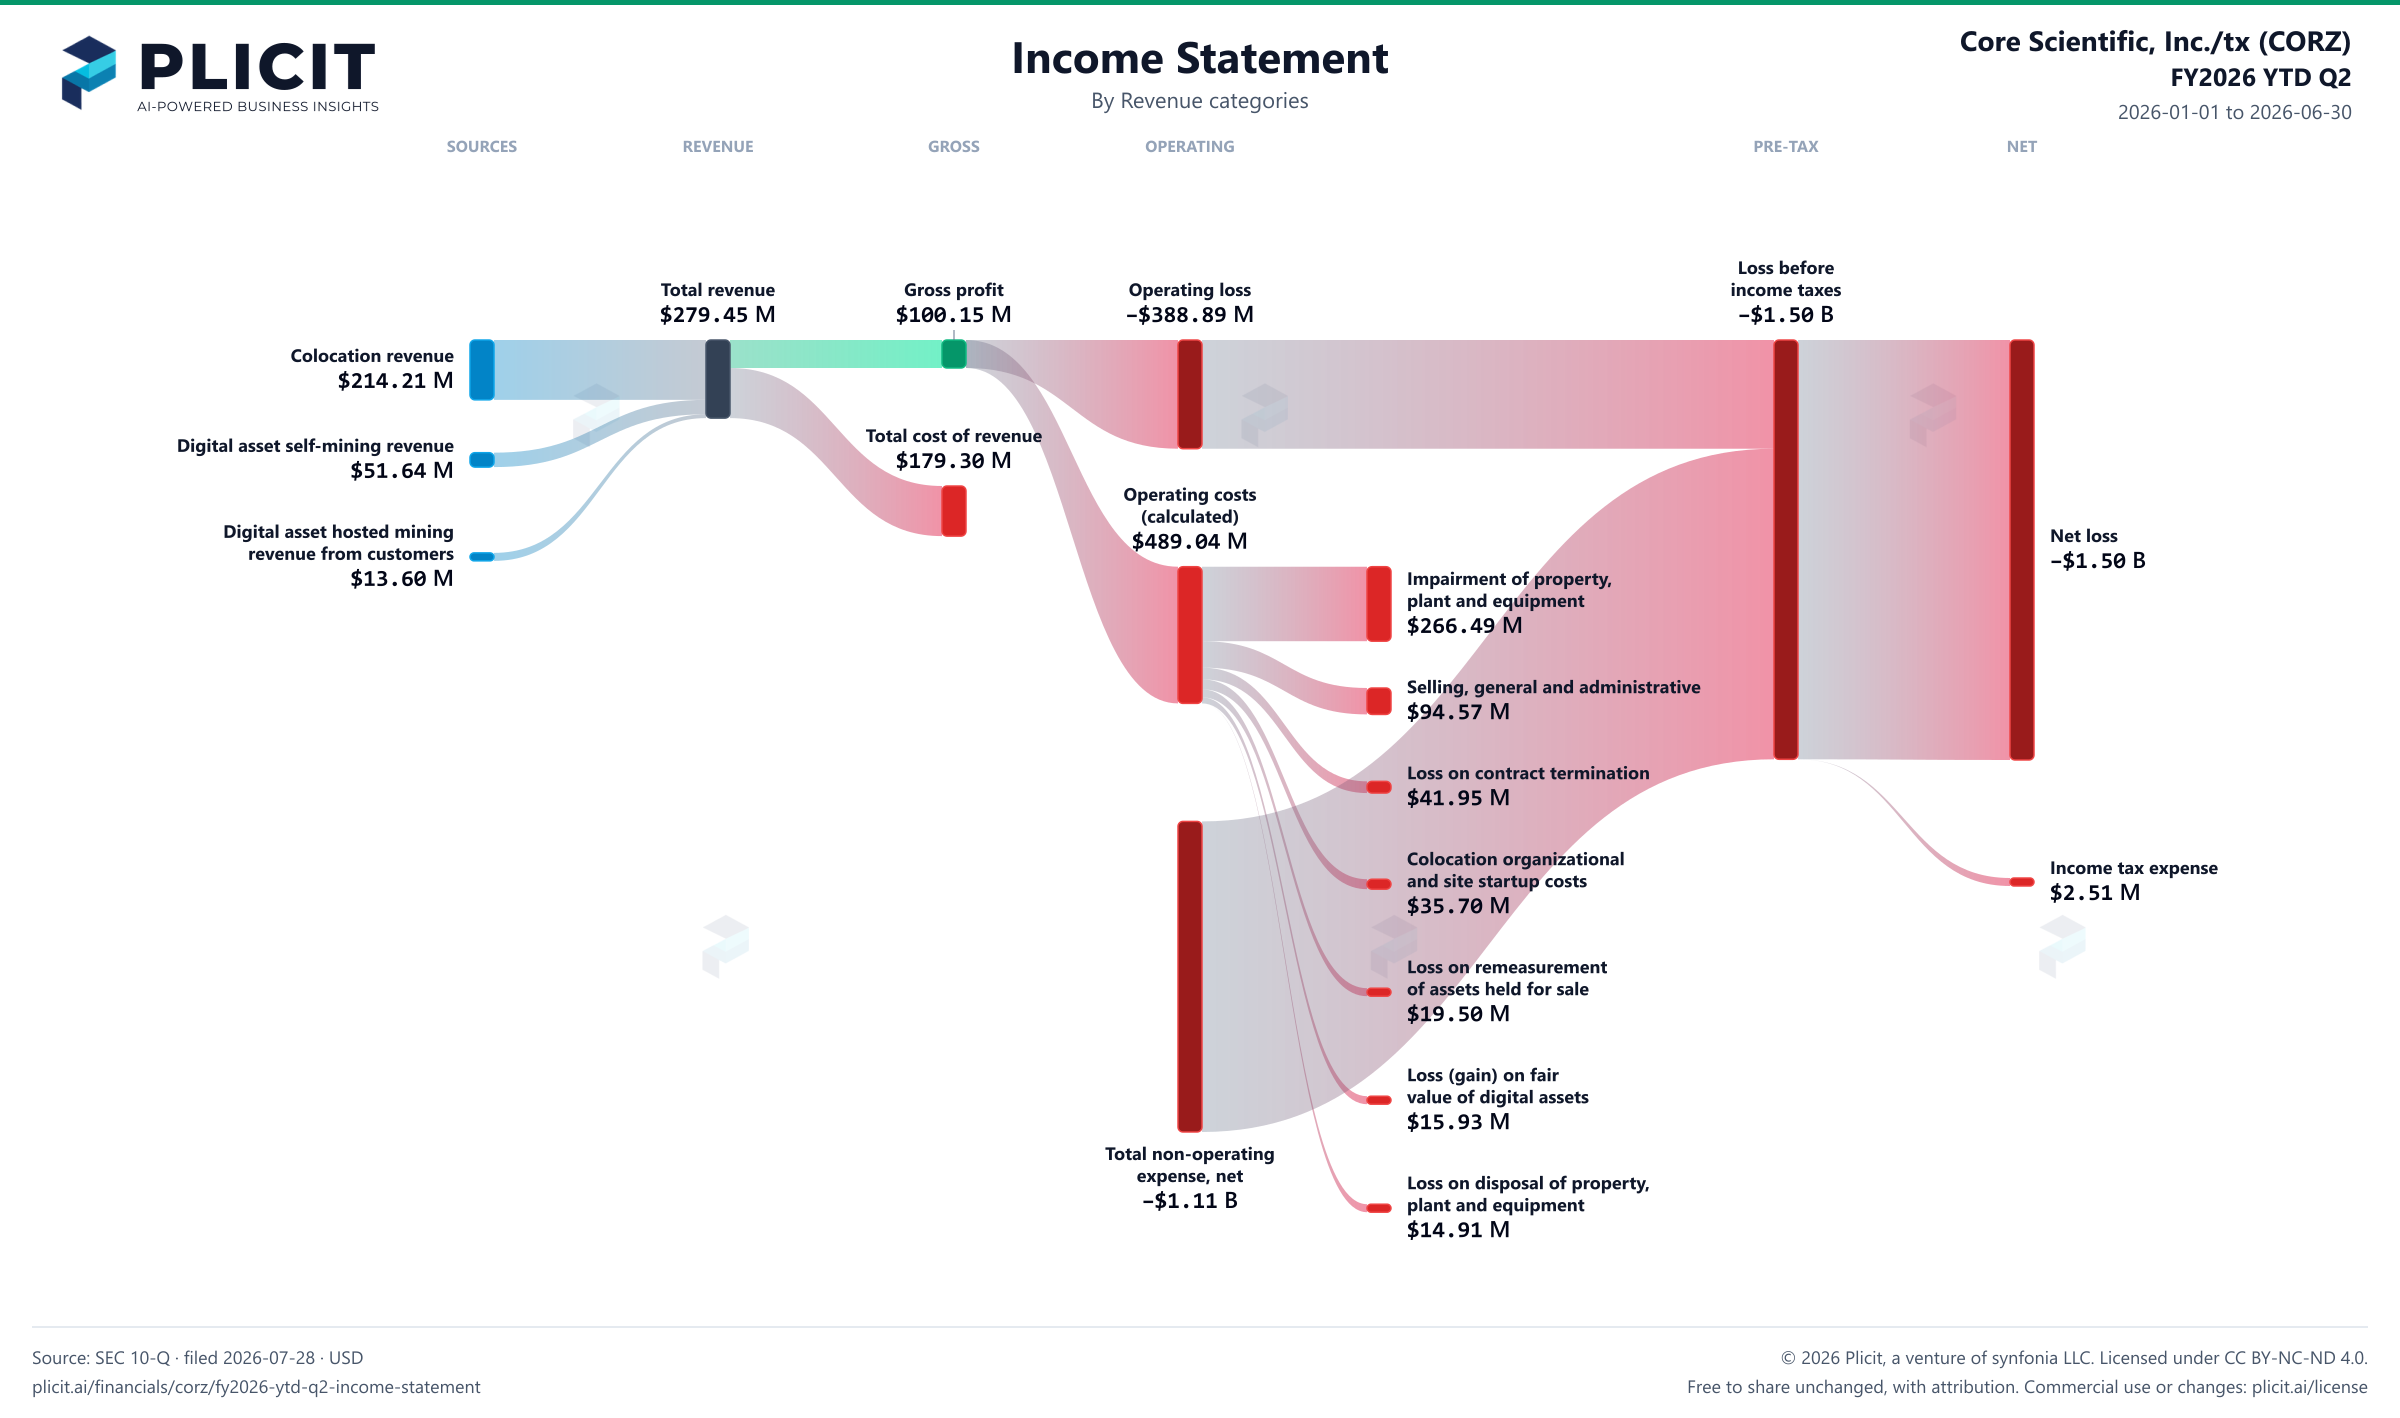
Core Scientific, Inc./tx (CORZ) FY2026 YTD Q2 P&L / Income Statement Sankey chart
Free to share unchanged, with credit to Plicit.ai · CC BY-NC-ND 4.0Download PNG

Gross margin

35.8%

Gross profit / revenue

Operating margin

−139.2%

Operating profit / revenue

Newsletter

Get the teardowns by email

Subscribe if you want the public-company teardowns in your inbox when they're released.

Product waitlist

Health Check and Teardown for your own company

A health check uncovers insights of your private books, not a public ticker. Join this list to get notified as soon as we go-live!