
California Resources Corp (CRC) FY2026 Q2 P&L / Income Statement

Revenue by Product and Service

2026-04-01 to 2026-06-30

Swipe to see the full flow
California Resources Corp (CRC) FY2026 Q2 P&L / Income StatementIncome statement for 2026-04-01 through 2026-06-30. View: Revenue categories. Revenue uses this breakdown; costs and expenses retain the consolidated categories.SOURCESREVENUEGROSSOPERATINGPRE-TAXNETOil, natural gas and natural gas liquids salesNet gain (loss) from commodity sales derivativesRevenue from marketing of purchased commoditiesElectricity revenueOther revenueTotal operating revenuesGross profit (calculated)Cost of revenue (calculated)Costs of salesOPERATING INCOME (LOSS)Operating expenses (calculated)Operating costsDepreciation, depletion and amortizationGeneral and administrative expensesAccretion expenseNet loss (gain) from natural gas purchase derivativesMeasurement period adjustments, netTaxes other than on incomeOther operating expenses, netINCOME (LOSS) BEFORE INCOME TAXESOther income (expense), net (calculated)NET INCOME (LOSS)Income tax benefit (provision)Income tax benefit (provision)Income tax benefit(provision)−$56.00 MTotal operating revenuesTotal operatingrevenues$1.30 BGross profit (calculated)Gross profit(calculated)$1.24 BOPERATING INCOME (LOSS)OPERATINGINCOME (LOSS)$511.00 MINCOME (LOSS) BEFORE INCOME TAXESINCOME (LOSS)BEFORE INCOME TAXES$458.00 MNET INCOME (LOSS)NET INCOME (LOSS)$514.00 MOil, natural gas and natural gas liquids salesOil, natural gas andnatural gas liquids sales$1.06 BOperating expenses (calculated)Operating expenses(calculated)$731.00 MOther income (expense), net (calculated)Other income,net (calculated)−$53.00 MOperating costsOperating costs$347.00 MNet gain (loss) from commodity sales derivativesNet gain (loss) fromcommodity sales derivatives$205.00 MDepreciation, depletion and amortizationDepreciation, depletionand amortization$131.00 MCost of revenue (calculated)Cost of revenue(calculated)$55.00 MRevenue from marketing of purchased commoditiesRevenue from marketingof purchased commodities$26.00 MGeneral and administrative expensesGeneral andadministrative expenses$97.00 MElectricity revenueElectricity revenue$6.00 MCosts of salesCosts of sales$55.00 MAccretion expenseAccretion expense$27.00 MOther revenueOther revenue$4.00 MNet loss (gain) from natural gas purchase derivativesNet loss (gain) from naturalgas purchase derivatives$5.00 MMeasurement period adjustments, netMeasurement periodadjustments, net−$2.00 MTaxes other than on incomeTaxes other than on income$66.00 MOther operating expenses, netOther operating expenses, net$60.00 M
Chart details

California Resources Corp (CRC) FY2026 Q2 P&L / Income Statement

Income statement for 2026-04-01 through 2026-06-30. View: Revenue categories. Revenue uses this breakdown; costs and expenses retain the consolidated categories.

Total operating revenues
1,297,000,000 US dollars
Cost of revenue (calculated)
55,000,000 US dollars
Gross profit (calculated)
1,242,000,000 US dollars
Operating expenses (calculated)
731,000,000 US dollars
OPERATING INCOME (LOSS)
511,000,000 US dollars
Other income (expense), net (calculated)
negative 53,000,000 US dollars
INCOME (LOSS) BEFORE INCOME TAXES
458,000,000 US dollars
Income tax benefit (provision)
negative 56,000,000 US dollars
NET INCOME (LOSS)
514,000,000 US dollars
Oil, natural gas and natural gas liquids sales
1,056,000,000 US dollars
Net gain (loss) from commodity sales derivatives
205,000,000 US dollars
Revenue from marketing of purchased commodities
26,000,000 US dollars
Electricity revenue
6,000,000 US dollars
Other revenue
4,000,000 US dollars
Costs of sales
55,000,000 US dollars
Operating costs
347,000,000 US dollars
General and administrative expenses
97,000,000 US dollars
Depreciation, depletion and amortization
131,000,000 US dollars
Taxes other than on income
66,000,000 US dollars
Accretion expense
27,000,000 US dollars
Net loss (gain) from natural gas purchase derivatives
5,000,000 US dollars
Measurement period adjustments, net
negative 2,000,000 US dollars
Other operating expenses, net
60,000,000 US dollars

Chart connections

  • Revenue less cost of revenue equals gross profit; gross profit less operating expenses equals operating income.
  • Operating income plus other income or expense equals income before tax. Income before tax less income tax expense or benefit equals net income.
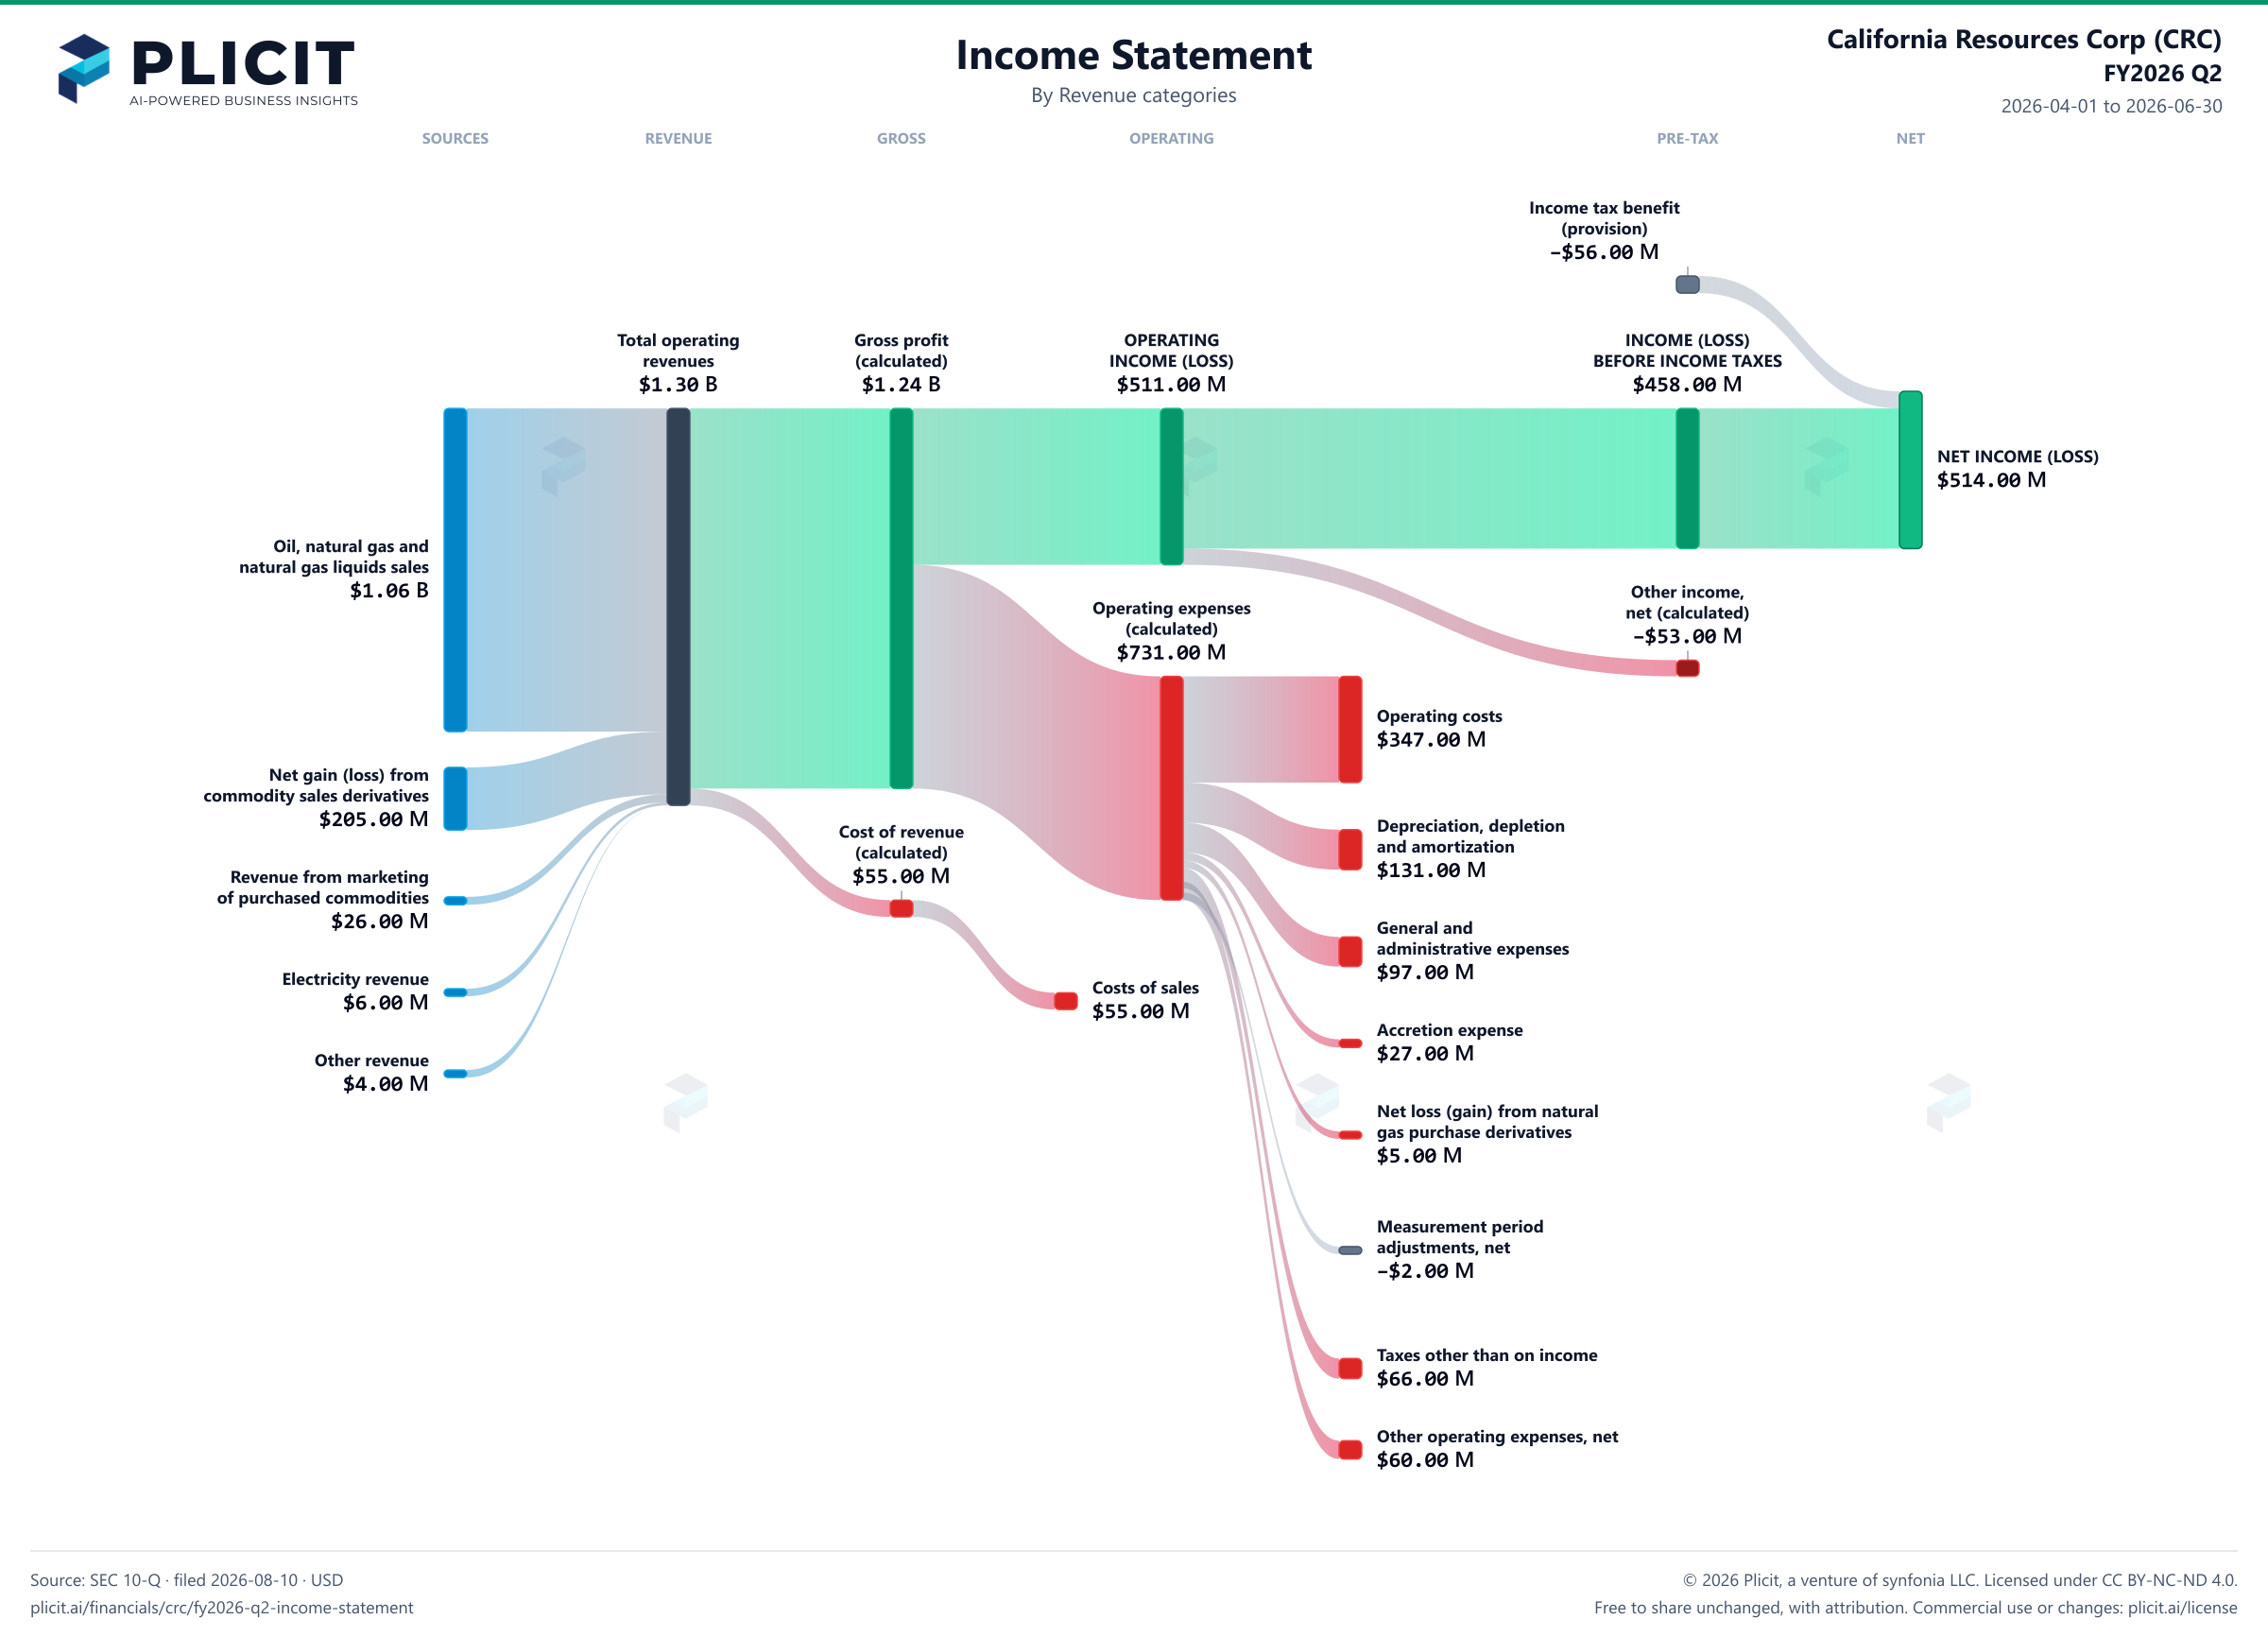
California Resources Corp (CRC) FY2026 Q2 P&L / Income Statement Sankey chart, Product and service view
Free to share unchanged, with credit to Plicit.ai · CC BY-NC-ND 4.0Download PNG

Gross margin

95.8%

Gross profit / revenue

Operating margin

39.4%

Operating profit / revenue

Cash conversion

51.2%

Operating cash / net income, same period

Newsletter

Get the teardowns by email

Subscribe if you want the public-company teardowns in your inbox when they're released.

Product waitlist

Health Check and Teardown for your own company

A health check uncovers insights of your private books, not a public ticker. Join this list to get notified as soon as we go-live!