
Credo Technology Group Holding Ltd (CRDO) FY2026 Q3 Balance Sheet

Balance Sheet

As of 2026-01-31

Swipe to see the full flow
Credo Technology Group Holding Ltd (CRDO) FY2026 Q3 Balance SheetBalance sheet as of 2026-01-31. The chart shows assets, liabilities and equity at that date.Current liabilities$165.19 MCurrent assets$1.79 BLiabilities$188.45 MAssets$2.04 BNon-current liabilities$23.26 MEquity$1.85 BNon-current assets$250.75 MHOLDINGSASSET CLASSASSETSCLAIM CLASSCLAIM SUB-CLASSCLAIMSCash and cash equivalentsAccounts receivableInventoriesShort-term investmentsOther current assetsProperty and equipment, netGoodwillOther non-current assetsIntangible assetRight-of-use assetsAccounts payableOther current liabilitiesAccrued compensation and benefitsNon-current operating lease liabilitiesOther non-current liabilitiesAdditional paid in capitalRetained earnings (accumulated deficit)Accumulated other comprehensive income (loss)Ordinary shares, $0.00005 par value; 1,000,000 shares authorized; 184,224 and 171,169 shares issued and outstanding at January 31, 2026 and May 3, 2025, respectivelyCurrent assetsNon-current assetsAssetsCurrent liabilitiesNon-current liabilitiesLiabilitiesEquityAccounts payableAccounts payable$93.82 MCurrent liabilitiesCurrent liabilities$165.19 MCurrent assetsCurrent assets$1.79 BOther current liabilitiesOther current liabilities$56.95 MLiabilitiesLiabilities$188.45 MCash and cash equivalentsCash and cash equivalents$1.22 BAccrued compensation and benefitsAccrued compensation and benefits$14.42 MAssetsAssets$2.04 BNon-current liabilitiesNon-current liabilities$23.26 MNon-current operating lease liabilitiesNon-current operating lease liabilities$12.62 MOther non-current liabilitiesOther non-current liabilities$10.65 MEquityEquity$1.85 BAccounts receivableAccounts receivable$243.21 MInventoriesInventories$207.96 MShort-term investmentsShort-term investments$81.00 MOther current assetsOther current assets$33.96 MAdditional paid in capitalAdditional paid in capital$1.63 BProperty and equipment, netProperty and equipment, net$105.99 MNon-current assetsNon-current assets$250.75 MGoodwillGoodwill$70.86 MOther non-current assetsOther non-current assets$40.76 MRetained earnings (accumulated deficit)Retained earnings (accumulated deficit)$220.02 MIntangible assetIntangible asset$17.62 MAccumulated other comprehensive income (loss)Accumulated other comprehensive income (loss)$2.08 MRight-of-use assetsRight-of-use assets$15.52 MOrdinary shares, $0.00005 par value; 1,000,000 shares authorized; 184,224 and 171,169 shares issued and outstanding at January 31, 2026 and May 3, 2025, respectivelyOrdinary shares$9.00 K
Chart details

Credo Technology Group Holding Ltd (CRDO) FY2026 Q3 Balance Sheet

Balance sheet as of 2026-01-31. The chart shows assets, liabilities and equity at that date.

Assets
2,037,339,000 US dollars
Current assets
1,786,593,000 US dollars
Non-current assets
250,746,000 US dollars
Liabilities
188,453,000 US dollars
Current liabilities
165,192,000 US dollars
Non-current liabilities
23,261,000 US dollars
Equity
1,848,886,000 US dollars
Cash and cash equivalents
1,220,464,000 US dollars
Accounts receivable
243,213,000 US dollars
Inventories
207,958,000 US dollars
Short-term investments
81,000,000 US dollars
Other current assets
33,958,000 US dollars
Property and equipment, net
105,989,000 US dollars
Goodwill
70,859,000 US dollars
Other non-current assets
40,757,000 US dollars
Intangible asset
17,624,000 US dollars
Right-of-use assets
15,517,000 US dollars
Accounts payable
93,822,000 US dollars
Other current liabilities
56,951,000 US dollars
Accrued compensation and benefits
14,419,000 US dollars
Non-current operating lease liabilities
12,616,000 US dollars
Other non-current liabilities
10,645,000 US dollars
Additional paid in capital
1,626,787,000 US dollars
Retained earnings (accumulated deficit)
220,015,000 US dollars
Accumulated other comprehensive income (loss)
2,075,000 US dollars
Ordinary shares, $0.00005 par value; 1,000,000 shares authorized; 184,224 and 171,169 shares issued and outstanding at January 31, 2026 and May 3, 2025, respectively
9,000 US dollars

Chart connections

  • Assets equal liabilities plus consolidated equity. Consolidated equity includes noncontrolling interests when reported.
  • Treasury shares and other negative equity contributions reduce equity.
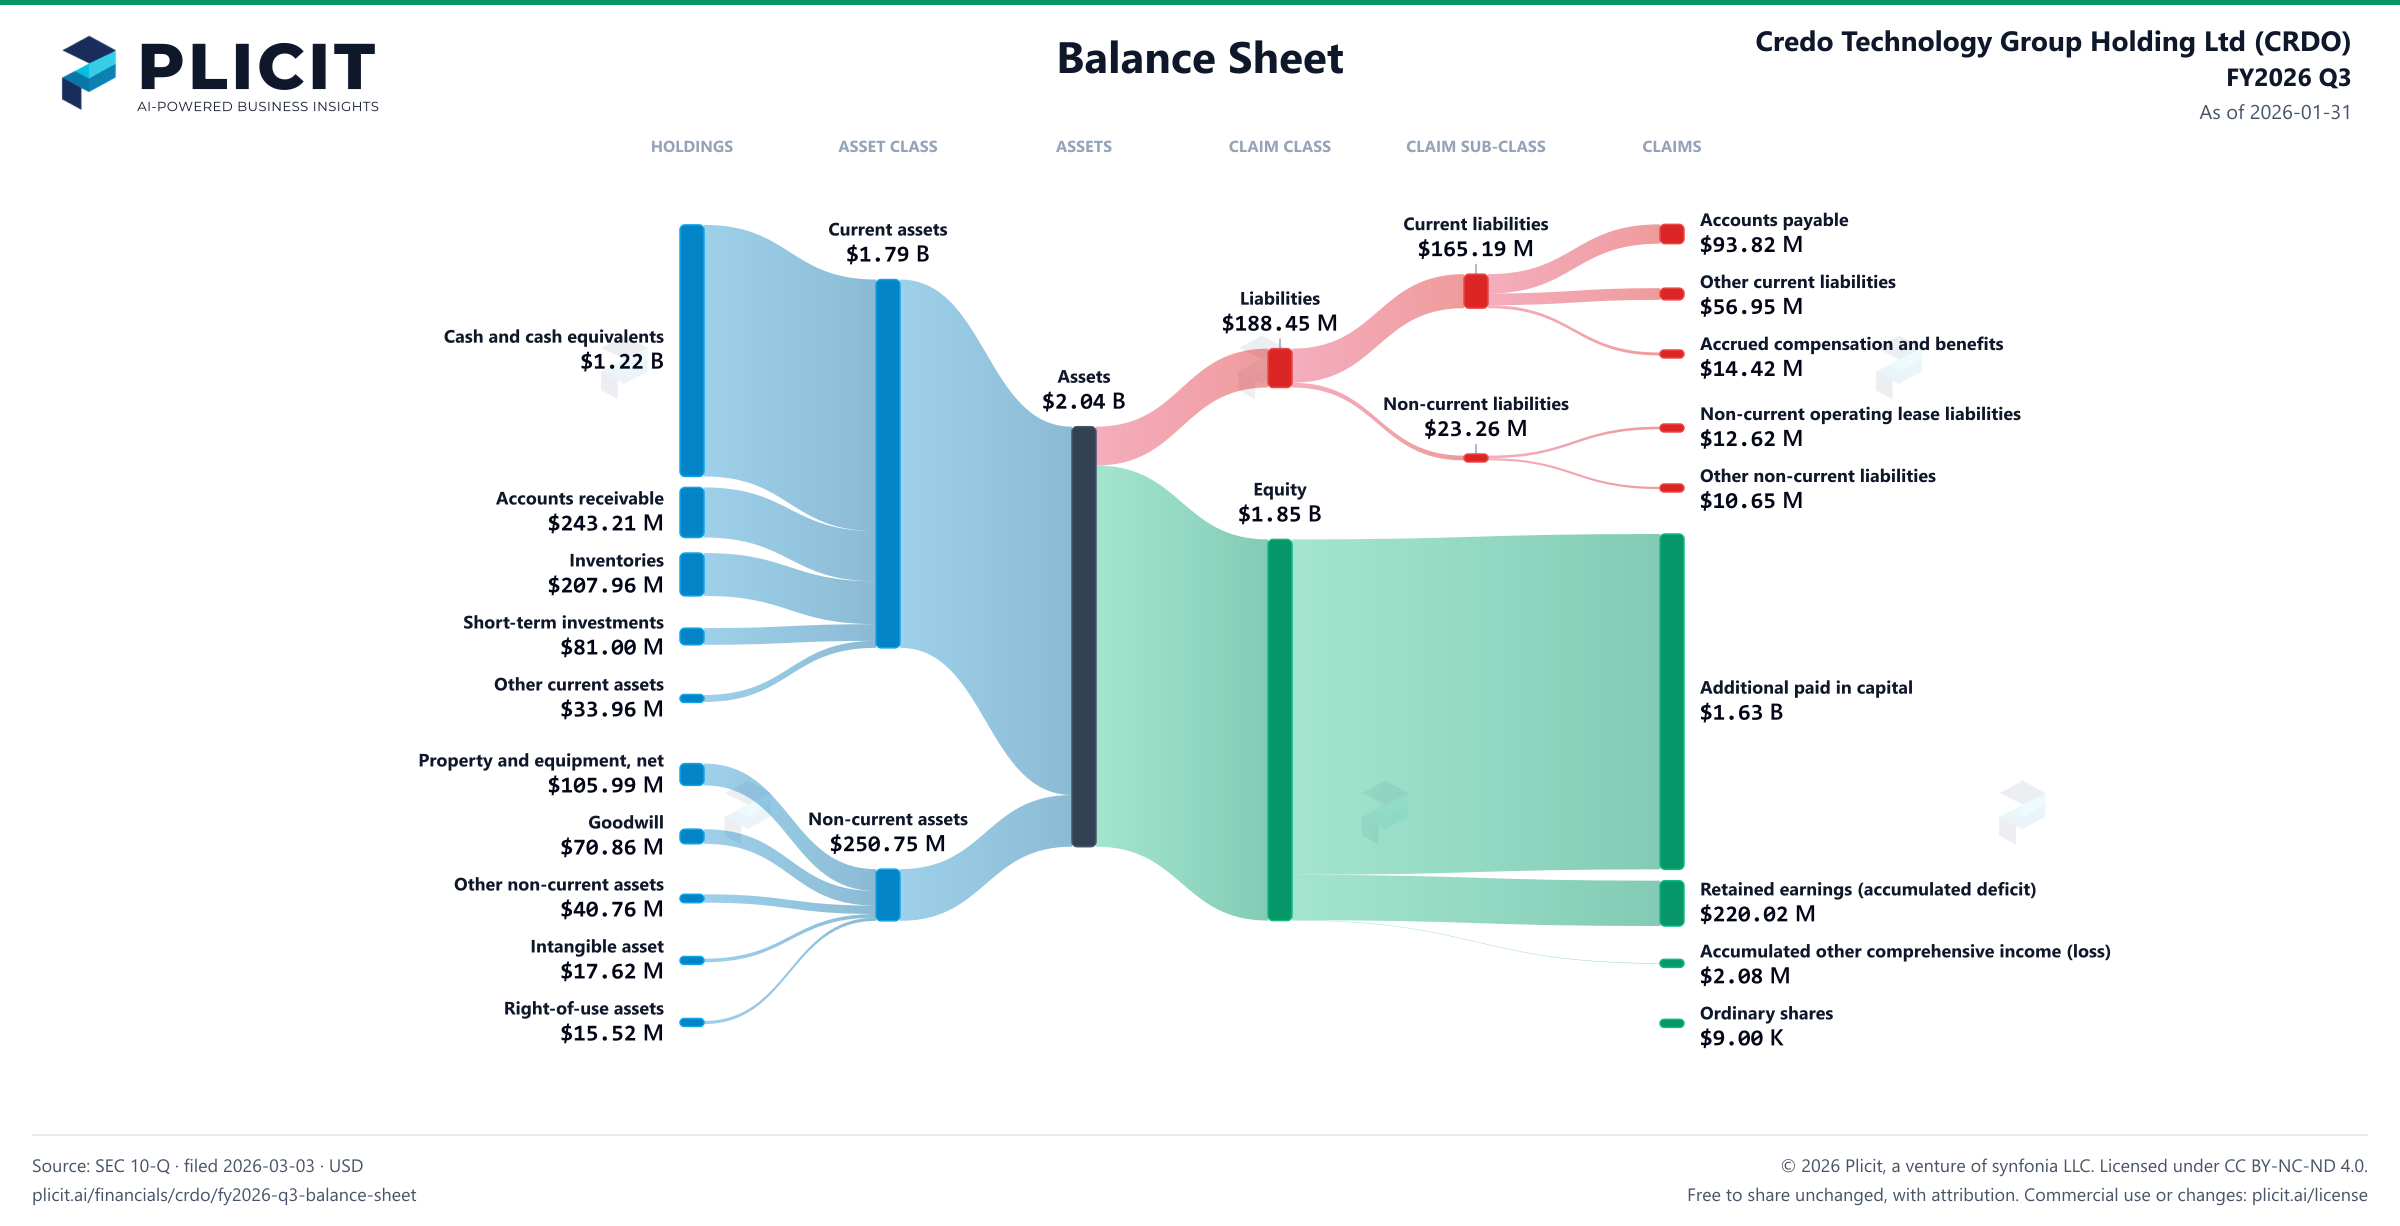
Credo Technology Group Holding Ltd (CRDO) FY2026 Q3 Balance Sheet Sankey chart
Free to share unchanged, with credit to Plicit.ai · CC BY-NC-ND 4.0Download PNG

Newsletter

Get the teardowns by email

Subscribe if you want the public-company teardowns in your inbox when they're released.

Product waitlist

Health Check and Teardown for your own company

A health check uncovers insights of your private books, not a public ticker. Join this list to get notified as soon as we go-live!