
CHARLES RIVER LABORATORIES INTERNATIONAL, INC. (CRL) FY2026 Q2 P&L / Income Statement

Revenue by Business Segment by Timing of Transfer

2026-03-29 to 2026-06-27

Swipe to see the full flow
CHARLES RIVER LABORATORIES INTERNATIONAL, INC. (CRL) FY2026 Q2 P&L / Income StatementIncome statement for 2026-03-29 through 2026-06-27. View: Segments by Timing of Transfer of Good or Service. Revenue uses this breakdown; costs and expenses retain the consolidated categories.SOURCESREVENUEGROSSOPERATINGPRE-TAXNETDiscovery and Safety Assessment Segment - Services and products transferred over timeResearch Models and Services Segment - Services and products transferred at a point in timeManufacturing - Services and products transferred at a point in timeResearch Models and Services Segment - Services and products transferred over timeManufacturing - Services and products transferred over timeDiscovery and Safety Assessment Segment - Services and products transferred at a point in timeTotal revenueGross profit (calculated)Cost of revenue (calculated)Cost of revenue (excluding amortization of intangible assets)Operating incomeOperating expenses (calculated)Selling, general and administrativeAmortization of intangible assetsIncome before income taxesOther income (expense), net (calculated)Net income (loss)Provision for income taxesGross profit (calculated)Gross profit(calculated)$363.37 MTotal revenueTotal revenue$1.00 BOperating incomeOperating income$119.89 MIncome before income taxesPretax income$53.17 MNet income (loss)Net income (loss)−$760.00 KOperating expenses (calculated)Operating expenses(calculated)$243.49 MDiscovery and Safety Assessment Segment - Services and products transferred over timeDSA - Services and productstransferred over time$605.94 MProvision for income taxesProvision forincome taxes$53.93 MOther income (expense), net (calculated)Other income,net (calculated)−$66.72 MCost of revenue (calculated)Cost of revenue(calculated)$640.70 MSelling, general and administrativeSelling, general and administrative$228.90 MResearch Models and Services Segment - Services and products transferred at a point in timeRMS - Services and productstransferred at a point in time$115.11 MAmortization of intangible assetsAmortization of intangible assets$14.59 MManufacturing - Services and products transferred at a point in timeManufacturing - Services andproducts transferred at a point in time$103.19 MCost of revenue (excluding amortization of intangible assets)Cost of revenue$640.70 MResearch Models and Services Segment - Services and products transferred over timeRMS - Services and productstransferred over time$94.37 MManufacturing - Services and products transferred over timeManufacturing - Services andproducts transferred over time$84.90 MDiscovery and Safety Assessment Segment - Services and products transferred at a point in timeDSA - Services and productstransferred at a point in time$572.00 K
Chart details

CHARLES RIVER LABORATORIES INTERNATIONAL, INC. (CRL) FY2026 Q2 P&L / Income Statement

Income statement for 2026-03-29 through 2026-06-27. View: Segments by Timing of Transfer of Good or Service. Revenue uses this breakdown; costs and expenses retain the consolidated categories.

Total revenue
1,004,078,000 US dollars
Cost of revenue (calculated)
640,704,000 US dollars
Gross profit (calculated)
363,374,000 US dollars
Operating expenses (calculated)
243,486,000 US dollars
Operating income
119,888,000 US dollars
Other income (expense), net (calculated)
negative 66,718,000 US dollars
Income before income taxes
53,170,000 US dollars
Provision for income taxes
53,930,000 US dollars
Net income (loss)
negative 760,000 US dollars
Discovery and Safety Assessment Segment - Services and products transferred at a point in time
572,000 US dollars
Discovery and Safety Assessment Segment - Services and products transferred over time
605,935,000 US dollars
Manufacturing - Services and products transferred at a point in time
103,192,000 US dollars
Manufacturing - Services and products transferred over time
84,904,000 US dollars
Research Models and Services Segment - Services and products transferred at a point in time
115,105,000 US dollars
Research Models and Services Segment - Services and products transferred over time
94,370,000 US dollars
Cost of revenue (excluding amortization of intangible assets)
640,704,000 US dollars
Amortization of intangible assets
14,589,000 US dollars
Selling, general and administrative
228,897,000 US dollars

Chart connections

  • Revenue less cost of revenue equals gross profit; gross profit less operating expenses equals operating income.
  • Operating income plus other income or expense equals income before tax. Income before tax less income tax expense or benefit equals net income.
  • Of which attributable to CHARLES RIVER LABORATORIES INTERNATIONAL, INC.: −$1.48 M; to noncontrolling interests: $722.00 K.
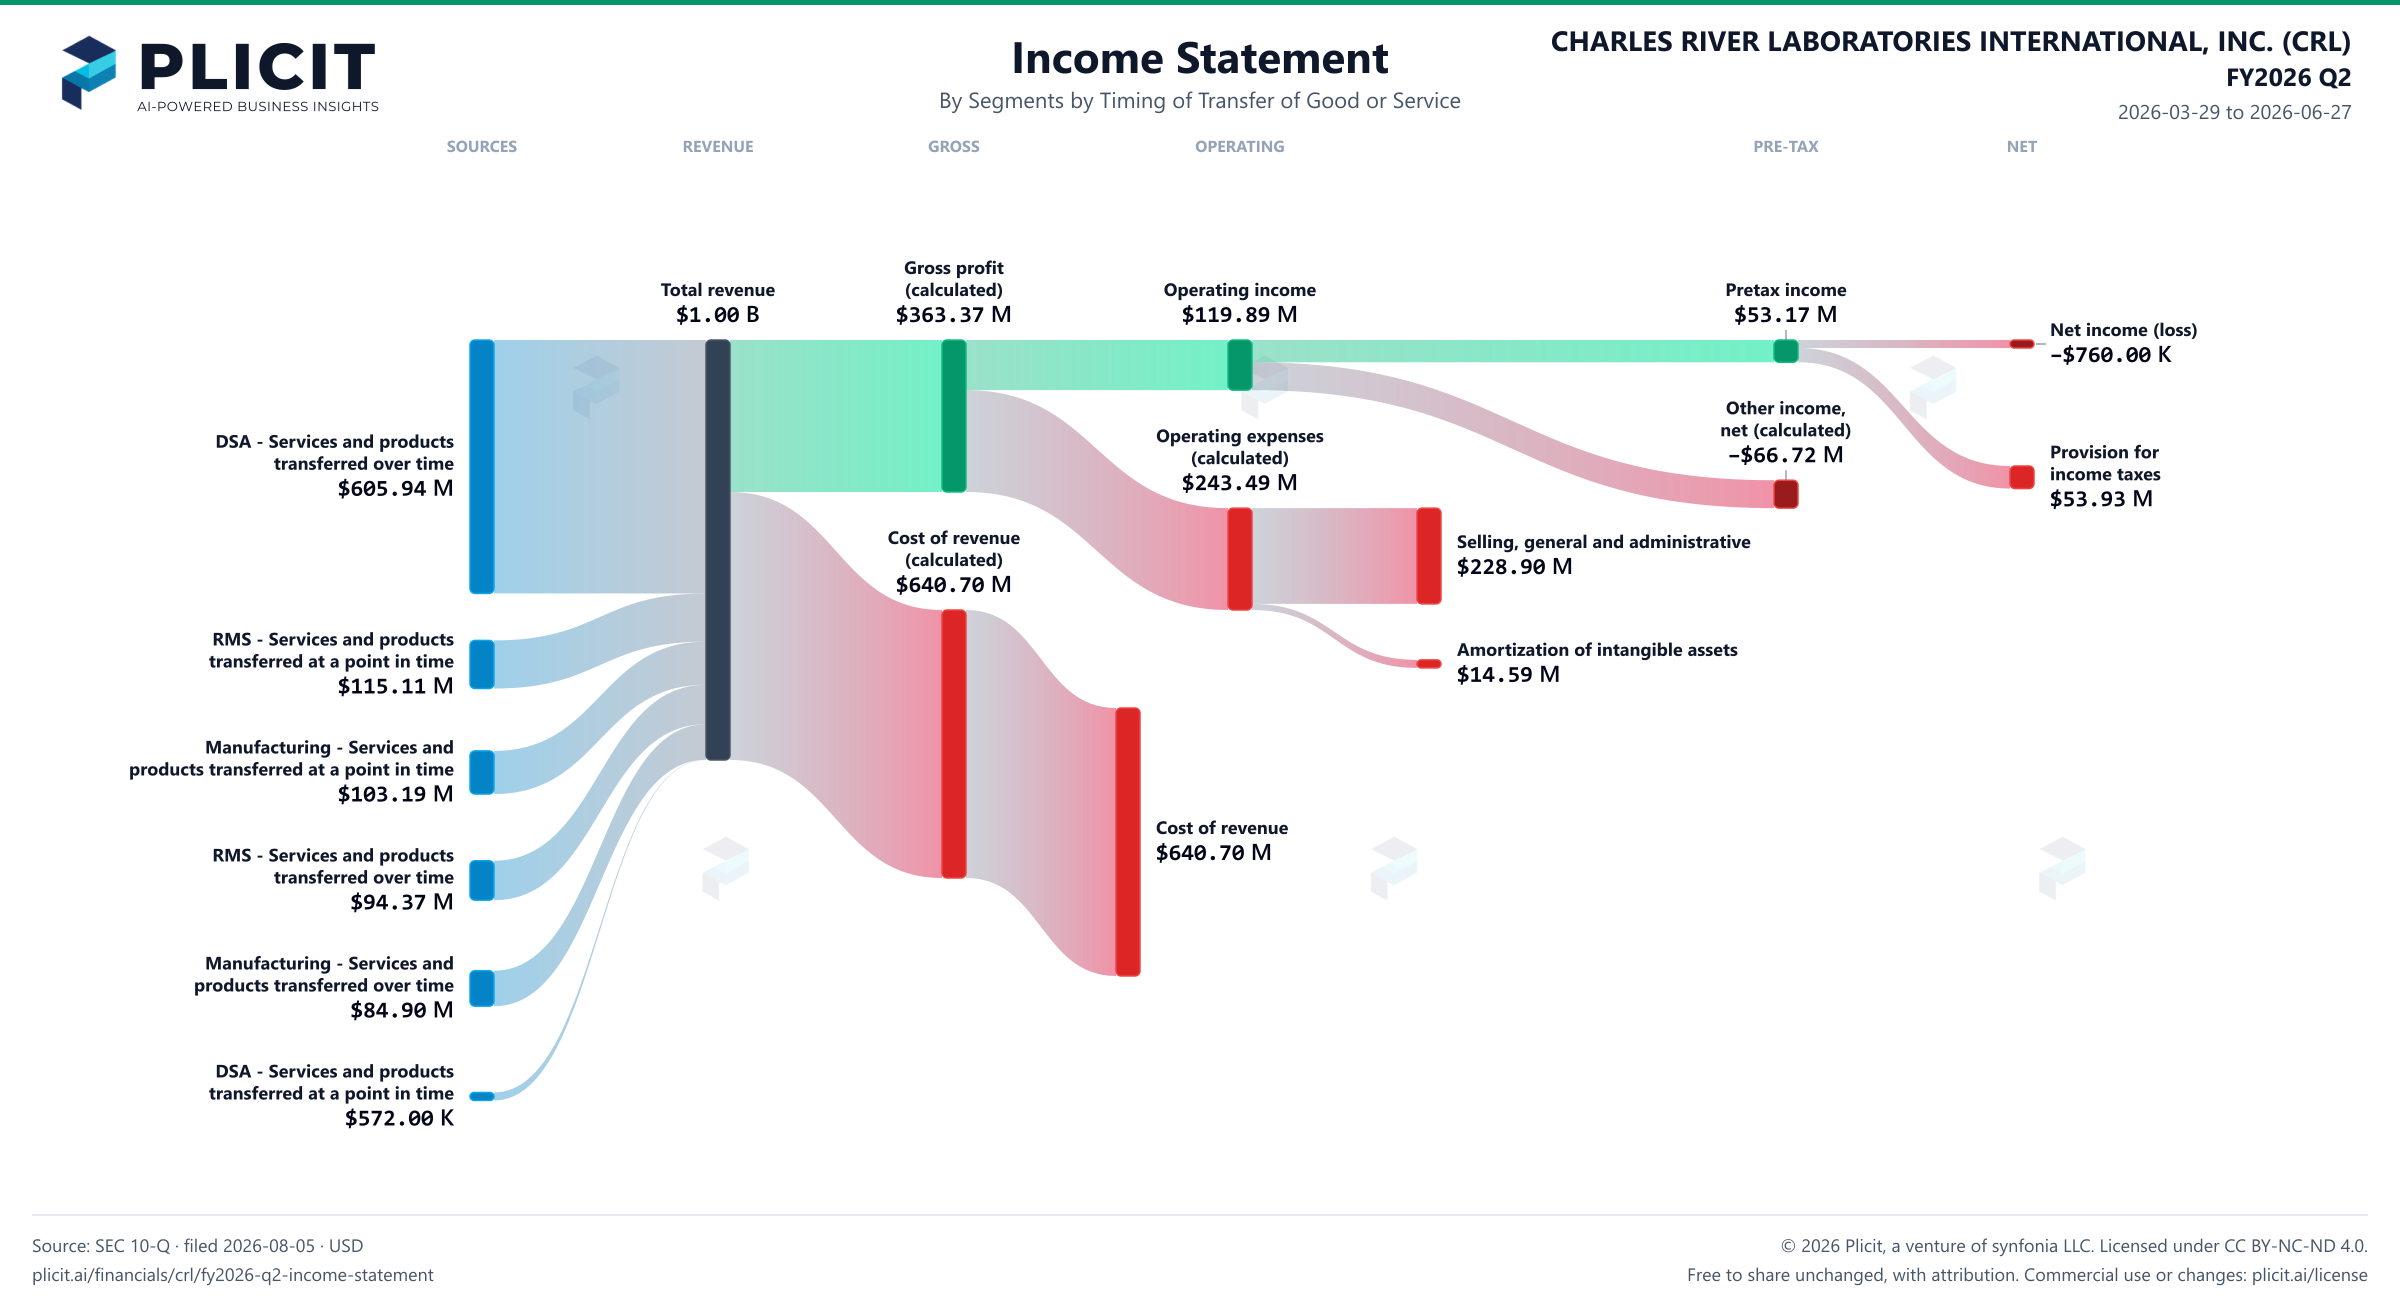
CHARLES RIVER LABORATORIES INTERNATIONAL, INC. (CRL) FY2026 Q2 Revenue by Business Segment by Timing of Transfer Sankey chart
Free to share unchanged, with credit to Plicit.ai · CC BY-NC-ND 4.0Download PNG

Gross margin

36.2%

Gross profit / revenue

Operating margin

11.9%

Operating profit / revenue

Newsletter

Get the teardowns by email

Subscribe if you want the public-company teardowns in your inbox when they're released.

Product waitlist

Health Check and Teardown for your own company

A health check uncovers insights of your private books, not a public ticker. Join this list to get notified as soon as we go-live!