
CVS HEALTH CORPORATION (CVS) FY2023 Annual Balance Sheet
As of 2023-12-31
Balance Sheet
As of 2023-12-31
Swipe to see the full flow
Chart details
CVS HEALTH CORPORATION (CVS) FY2023 Annual Balance Sheet
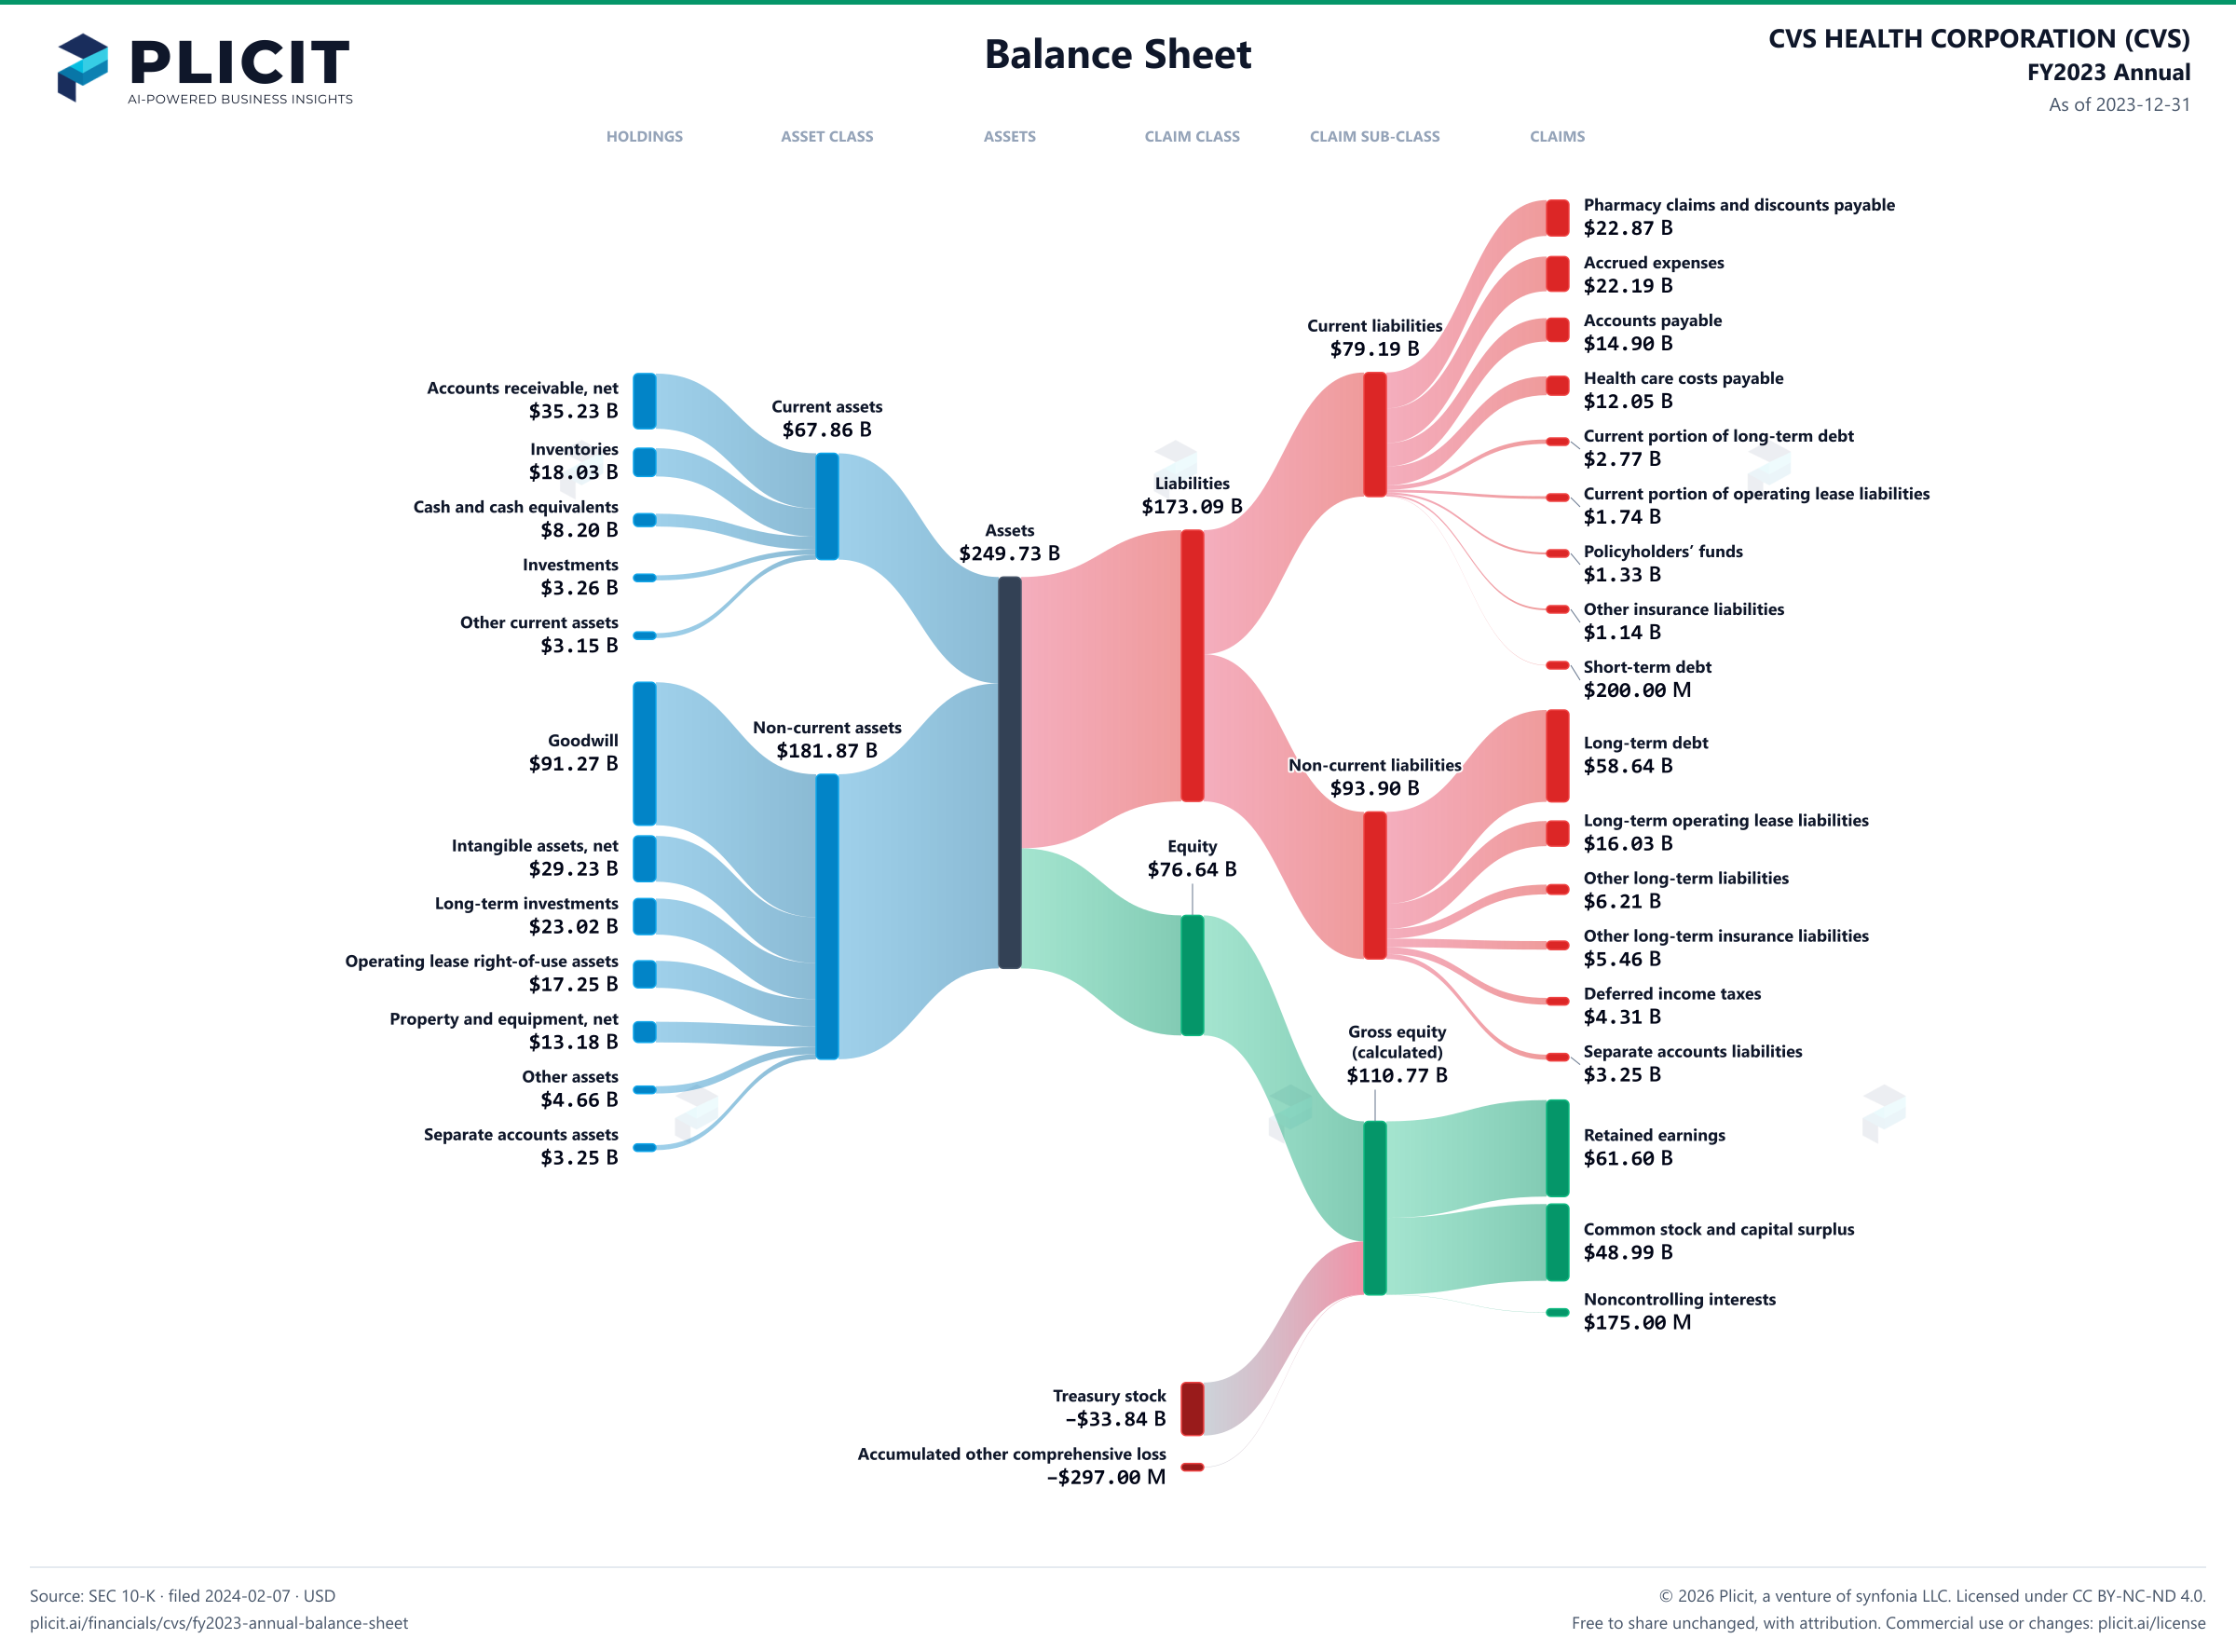
Balance sheet as of 2023-12-31. The chart shows assets, liabilities and equity at that date.
- Assets
- 249,728,000,000 US dollars
- Current assets
- 67,858,000,000 US dollars
- Non-current assets
- 181,870,000,000 US dollars
- Liabilities
- 173,092,000,000 US dollars
- Current liabilities
- 79,189,000,000 US dollars
- Non-current liabilities
- 93,903,000,000 US dollars
- Equity
- 76,636,000,000 US dollars
- Noncontrolling interest
- 175,000,000 US dollars. Included in consolidated equity; this amount is not added again.
- Accounts receivable, net
- 35,227,000,000 US dollars
- Inventories
- 18,025,000,000 US dollars
- Cash and cash equivalents
- 8,196,000,000 US dollars
- Investments
- 3,259,000,000 US dollars
- Other current assets
- 3,151,000,000 US dollars
- Assets held for sale
- 0 US dollars
- Goodwill
- 91,272,000,000 US dollars
- Intangible assets, net
- 29,234,000,000 US dollars
- Long-term investments
- 23,019,000,000 US dollars
- Operating lease right-of-use assets
- 17,252,000,000 US dollars
- Property and equipment, net
- 13,183,000,000 US dollars
- Other assets
- 4,660,000,000 US dollars
- Separate accounts assets
- 3,250,000,000 US dollars
- Pharmacy claims and discounts payable
- 22,874,000,000 US dollars
- Accrued expenses
- 22,189,000,000 US dollars
- Accounts payable
- 14,897,000,000 US dollars
- Health care costs payable
- 12,049,000,000 US dollars
- Current portion of long-term debt
- 2,772,000,000 US dollars
- Current portion of operating lease liabilities
- 1,741,000,000 US dollars
- Policyholders’ funds
- 1,326,000,000 US dollars
- Other insurance liabilities
- 1,141,000,000 US dollars
- Short-term debt
- 200,000,000 US dollars
- Liabilities held for sale
- 0 US dollars
- Long-term debt
- 58,638,000,000 US dollars
- Long-term operating lease liabilities
- 16,034,000,000 US dollars
- Other long-term liabilities
- 6,211,000,000 US dollars
- Other long-term insurance liabilities
- 5,459,000,000 US dollars
- Deferred income taxes
- 4,311,000,000 US dollars
- Separate accounts liabilities
- 3,250,000,000 US dollars
- Retained earnings
- 61,604,000,000 US dollars
- Common stock, par value $0.01: 3,200 shares authorized; 1,768 shares issued and 1,288 shares outstanding at December 31, 2023 and 1,758 shares issued and 1,300 shares outstanding at December 31, 2022 and capital surplus
- 48,992,000,000 US dollars
- Preferred stock, par value $0.01: 0.1 shares authorized; none issued or outstanding
- 0 US dollars
- Noncontrolling interests
- 175,000,000 US dollars
- Treasury stock, at cost: 480 and 458 shares at December 31, 2023 and 2022
- negative 33,838,000,000 US dollars
- Accumulated other comprehensive loss
- negative 297,000,000 US dollars
- Gross equity (calculated)
- 110,771,000,000 US dollars. Net equity plus the magnitudes of its negative contributions equals gross positive equity. The negative contributions enter this reconciliation as add-backs; their filed signs stay negative.
Chart connections
- Assets equal liabilities plus consolidated equity. Consolidated equity includes noncontrolling interests when reported.
- Treasury shares and other negative equity contributions reduce equity.
Free to share unchanged, with credit to Plicit.ai · CC BY-NC-ND 4.0Download PNG
Product waitlist
Health Check and Teardown for your own company
A health check uncovers insights of your private books, not a public ticker. Join this list to get notified as soon as we go-live!