
Chevron Corp (CVX) FY2026 Q1 Balance Sheet
As of 2026-03-31
Balance Sheet
As of 2026-03-31
Swipe to see the full flow
Chart details
Chevron Corp (CVX) FY2026 Q1 Balance Sheet
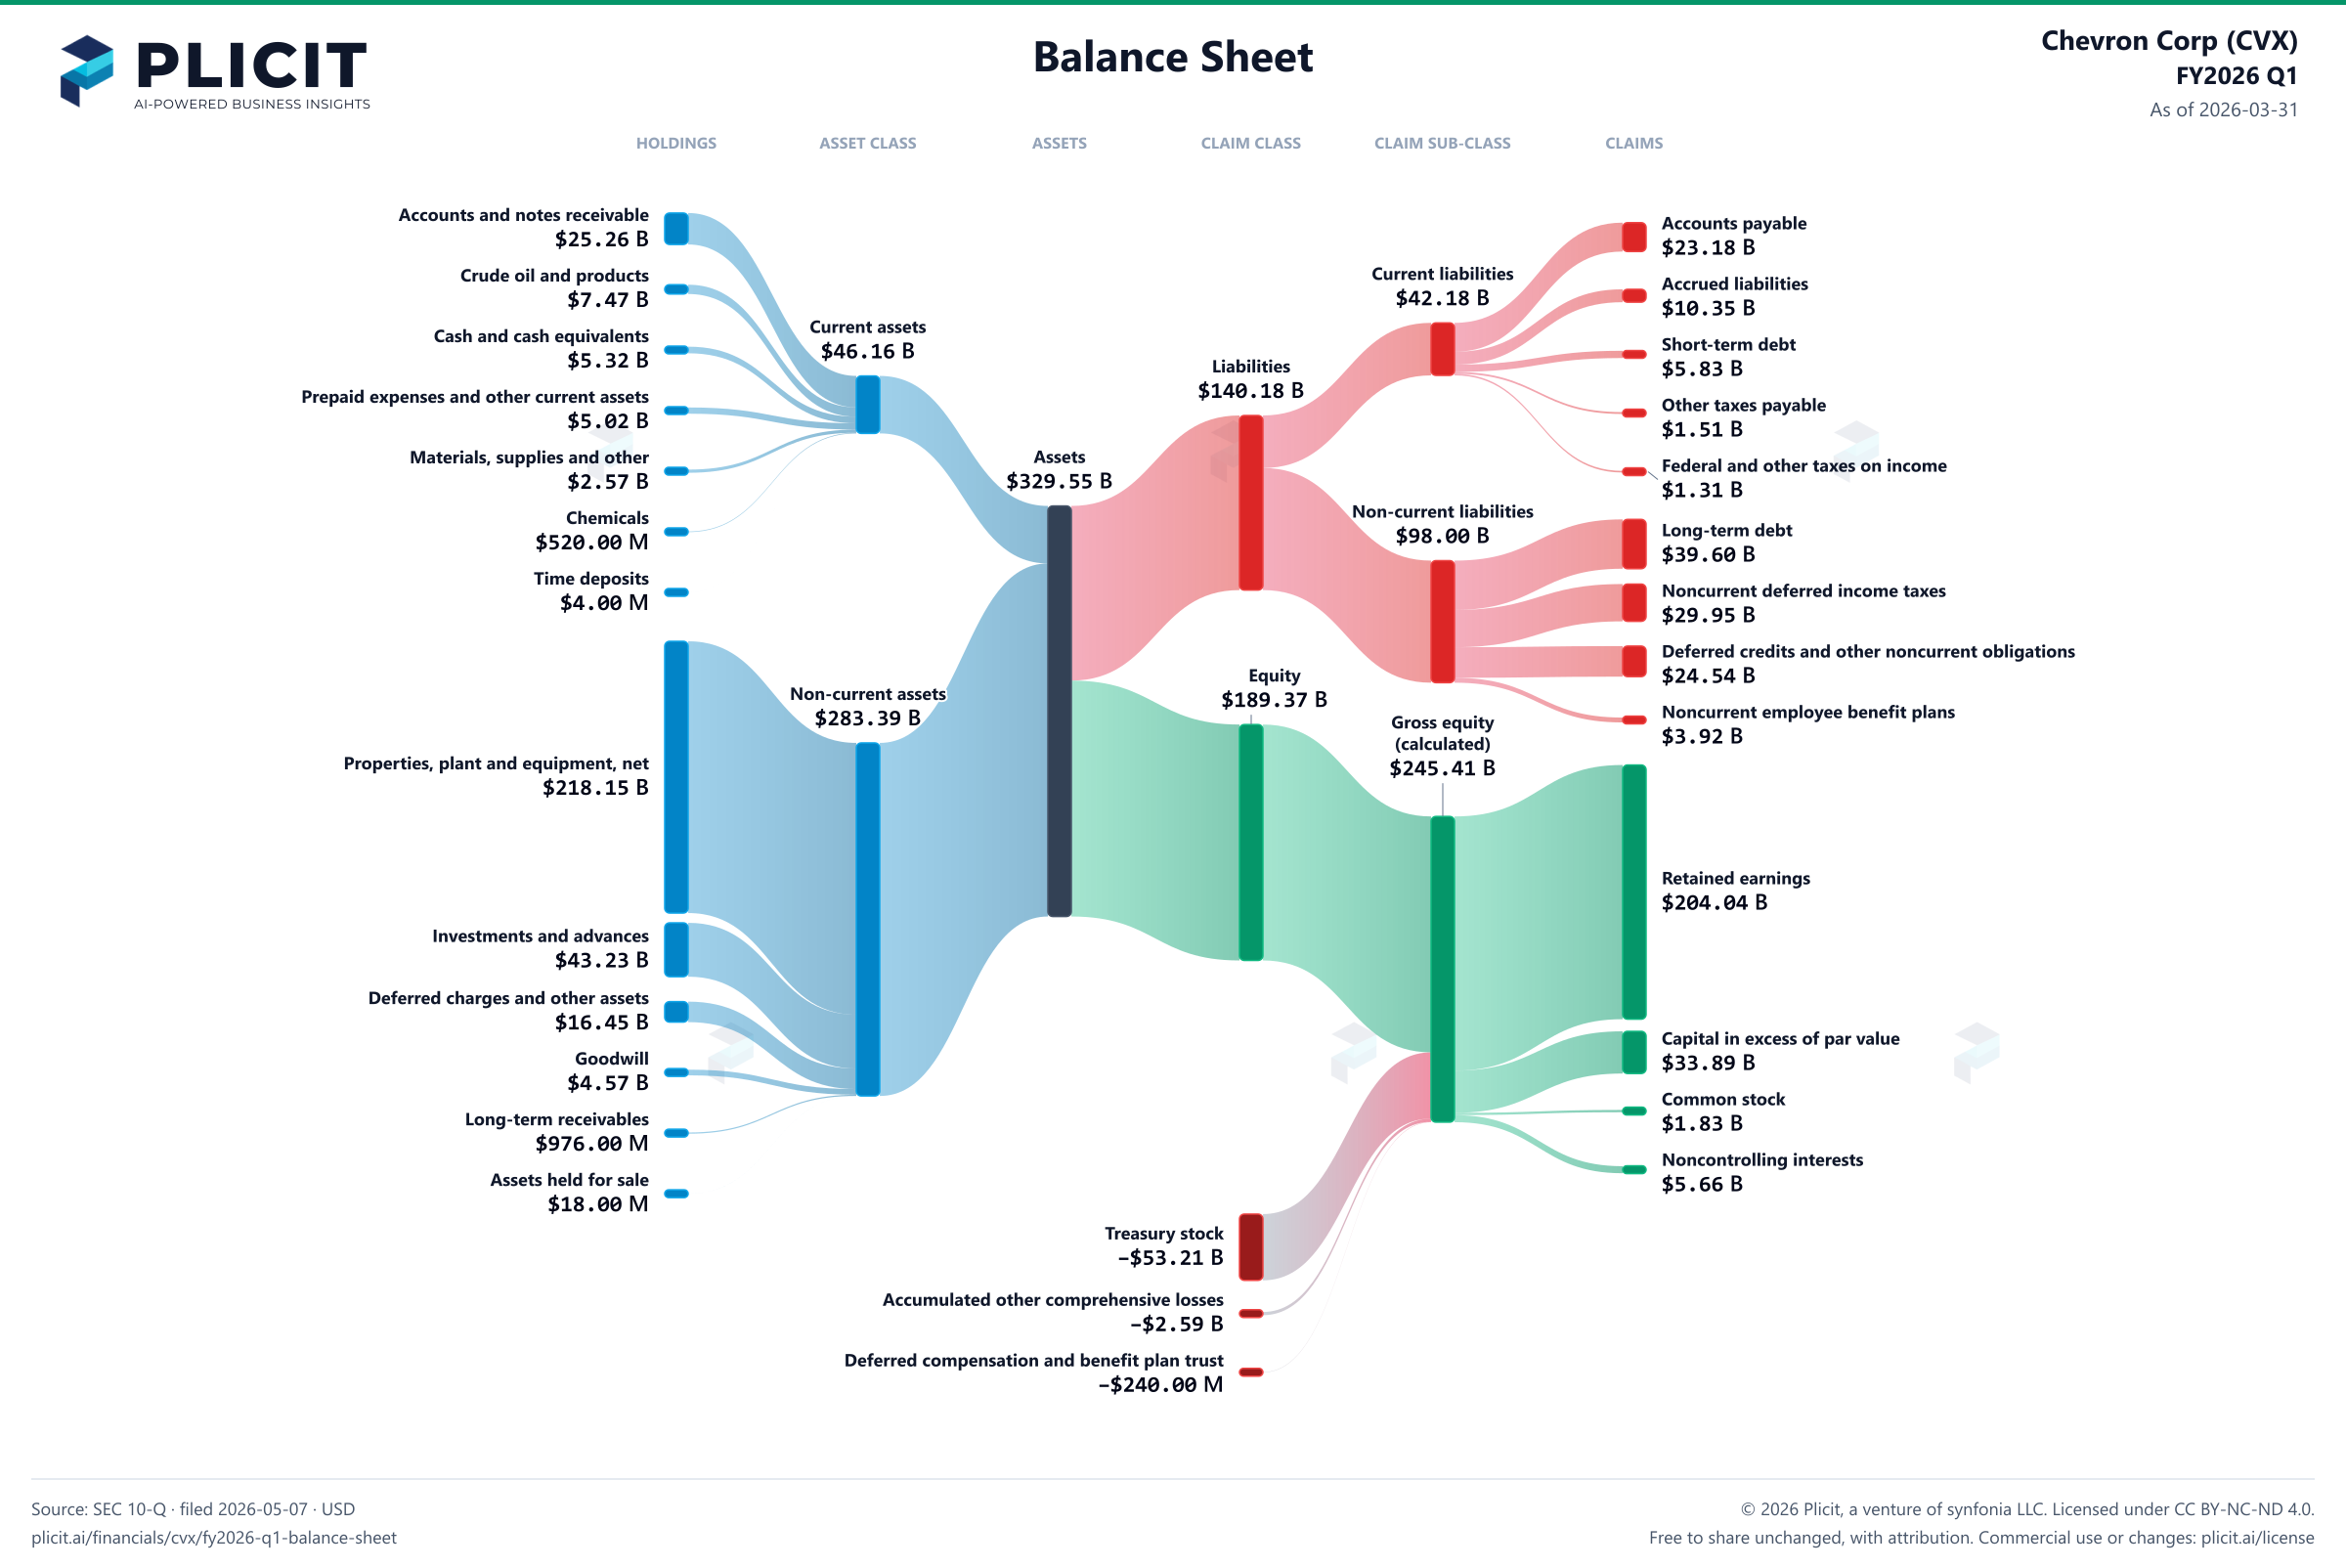
Balance sheet as of 2026-03-31. The chart shows assets, liabilities and equity at that date.
- Assets
- 329,551,000,000 US dollars
- Current assets
- 46,160,000,000 US dollars
- Non-current assets
- 283,391,000,000 US dollars
- Liabilities
- 140,180,000,000 US dollars
- Current liabilities
- 42,176,000,000 US dollars
- Non-current liabilities
- 98,004,000,000 US dollars
- Equity
- 189,371,000,000 US dollars
- Noncontrolling interest
- 5,656,000,000 US dollars. Included in consolidated equity; this amount is not added again.
- Properties, plant and equipment, at cost
- 438,923,000,000 US dollars. Part of Properties, plant and equipment, net, drawn as one net amount.
- Less: Accumulated depreciation, depletion and amortization
- negative 220,774,000,000 US dollars. Part of Properties, plant and equipment, net, drawn as one net amount.
- Accounts and notes receivable (less allowance: 2026 - $175; 2025 - $176)
- 25,256,000,000 US dollars
- Crude oil and products
- 7,468,000,000 US dollars
- Cash and cash equivalents
- 5,323,000,000 US dollars
- Prepaid expenses and other current assets
- 5,023,000,000 US dollars
- Materials, supplies and other
- 2,566,000,000 US dollars
- Chemicals
- 520,000,000 US dollars
- Time deposits
- 4,000,000 US dollars
- Properties, plant and equipment, net
- 218,149,000,000 US dollars
- Investments and advances
- 43,227,000,000 US dollars
- Deferred charges and other assets
- 16,453,000,000 US dollars
- Goodwill
- 4,568,000,000 US dollars
- Long-term receivables (less allowance: 2026 - $216; 2025 - $216)
- 976,000,000 US dollars
- Assets held for sale
- 18,000,000 US dollars
- Accounts payable
- 23,181,000,000 US dollars
- Accrued liabilities
- 10,349,000,000 US dollars
- Short-term debt
- 5,828,000,000 US dollars
- Other taxes payable
- 1,506,000,000 US dollars
- Federal and other taxes on income
- 1,312,000,000 US dollars
- Long-term debt
- 39,600,000,000 US dollars
- Noncurrent deferred income taxes
- 29,945,000,000 US dollars
- Deferred credits and other noncurrent obligations
- 24,536,000,000 US dollars
- Noncurrent employee benefit plans
- 3,923,000,000 US dollars
- Retained earnings
- 204,039,000,000 US dollars
- Capital in excess of par value
- 33,886,000,000 US dollars
- Common stock (authorized 6,000,000,000 shares, $0.75 par value; 2,442,676,580 shares issued at March 31, 2026 and December 31, 2025)
- 1,832,000,000 US dollars
- Preferred stock (authorized 100,000,000 shares; $1.00 par value; none issued)
- 0 US dollars
- Noncontrolling interests
- 5,656,000,000 US dollars
- Treasury stock, at cost (451,078,848 and 448,260,458 shares at March 31, 2026 and December 31, 2025, respectively)
- negative 53,209,000,000 US dollars
- Accumulated other comprehensive losses
- negative 2,593,000,000 US dollars
- Deferred compensation and benefit plan trust
- negative 240,000,000 US dollars
- Gross equity (calculated)
- 245,413,000,000 US dollars. Net equity plus the magnitudes of its negative contributions equals gross positive equity. The negative contributions enter this reconciliation as add-backs; their filed signs stay negative.
Chart connections
- Assets equal liabilities plus consolidated equity. Consolidated equity includes noncontrolling interests when reported.
- Treasury shares and other negative equity contributions reduce equity.
Free to share unchanged, with credit to Plicit.ai · CC BY-NC-ND 4.0Download PNG
Product waitlist
Health Check and Teardown for your own company
A health check uncovers insights of your private books, not a public ticker. Join this list to get notified as soon as we go-live!