
CASELLA WASTE SYSTEMS, INC. (CWST) FY2026 Q2 Balance Sheet
Published Source: Form 10-Q on SEC EDGAR filed (opens in a new tab)
Balance Sheet
Swipe to see the full flow
Chart details
CASELLA WASTE SYSTEMS, INC. (CWST) FY2026 Q2 Balance Sheet
Balance sheet as of 2026-06-30. The chart shows assets, liabilities and equity at that date.
- Assets
- 3,557,516,000 US dollars
- Current assets
- 314,592,000 US dollars
- Non-current assets
- 3,242,924,000 US dollars
- Liabilities (calculated)
- 1,977,492,000 US dollars
- Current liabilities
- 316,959,000 US dollars
- Non-current liabilities
- 1,660,533,000 US dollars
- Equity
- 1,580,024,000 US dollars
- Accounts receivable, net of allowance for credit losses of $7,720 and $7,082, respectively
- 220,366,000 US dollars
- Prepaid expenses
- 34,844,000 US dollars
- Other current assets
- 33,841,000 US dollars
- Cash and cash equivalents
- 25,541,000 US dollars
- Property and equipment, net of accumulated depreciation and amortization of $1,611,612 and $1,495,563, respectively
- 1,381,271,000 US dollars
- Goodwill
- 1,372,773,000 US dollars
- Intangible assets, net
- 341,589,000 US dollars
- Operating lease right-of-use assets
- 111,528,000 US dollars
- Other non-current assets
- 21,664,000 US dollars
- Cost method investments
- 10,967,000 US dollars
- Restricted cash and assets
- 3,132,000 US dollars
- Accounts payable
- 126,550,000 US dollars
- Other accrued liabilities
- 74,389,000 US dollars
- Contract liabilities
- 43,880,000 US dollars
- Accrued payroll and related expenses
- 27,774,000 US dollars
- Current maturities of debt
- 25,580,000 US dollars
- Current operating lease liabilities
- 12,304,000 US dollars
- Current accrued final capping, closure and post-closure costs
- 6,482,000 US dollars
- Debt, less current portion
- 1,325,132,000 US dollars
- Accrued final capping, closure and post-closure costs, less current portion
- 198,481,000 US dollars
- Operating lease liabilities, less current portion
- 81,988,000 US dollars
- Other long-term liabilities
- 31,809,000 US dollars
- Deferred income taxes, net
- 23,123,000 US dollars
- Additional paid-in capital
- 1,705,710,000 US dollars
- Common stock - Class A Common Stock
- 627,000 US dollars
- Accumulated other comprehensive income (loss), net of tax
- 560,000 US dollars
- Common stock - Class B Common Stock
- 10,000 US dollars
- Accumulated deficit
- negative 126,883,000 US dollars
Chart connections
- Assets equal liabilities plus consolidated equity. Consolidated equity includes noncontrolling interests when reported.
- Treasury shares and other negative equity contributions reduce equity.
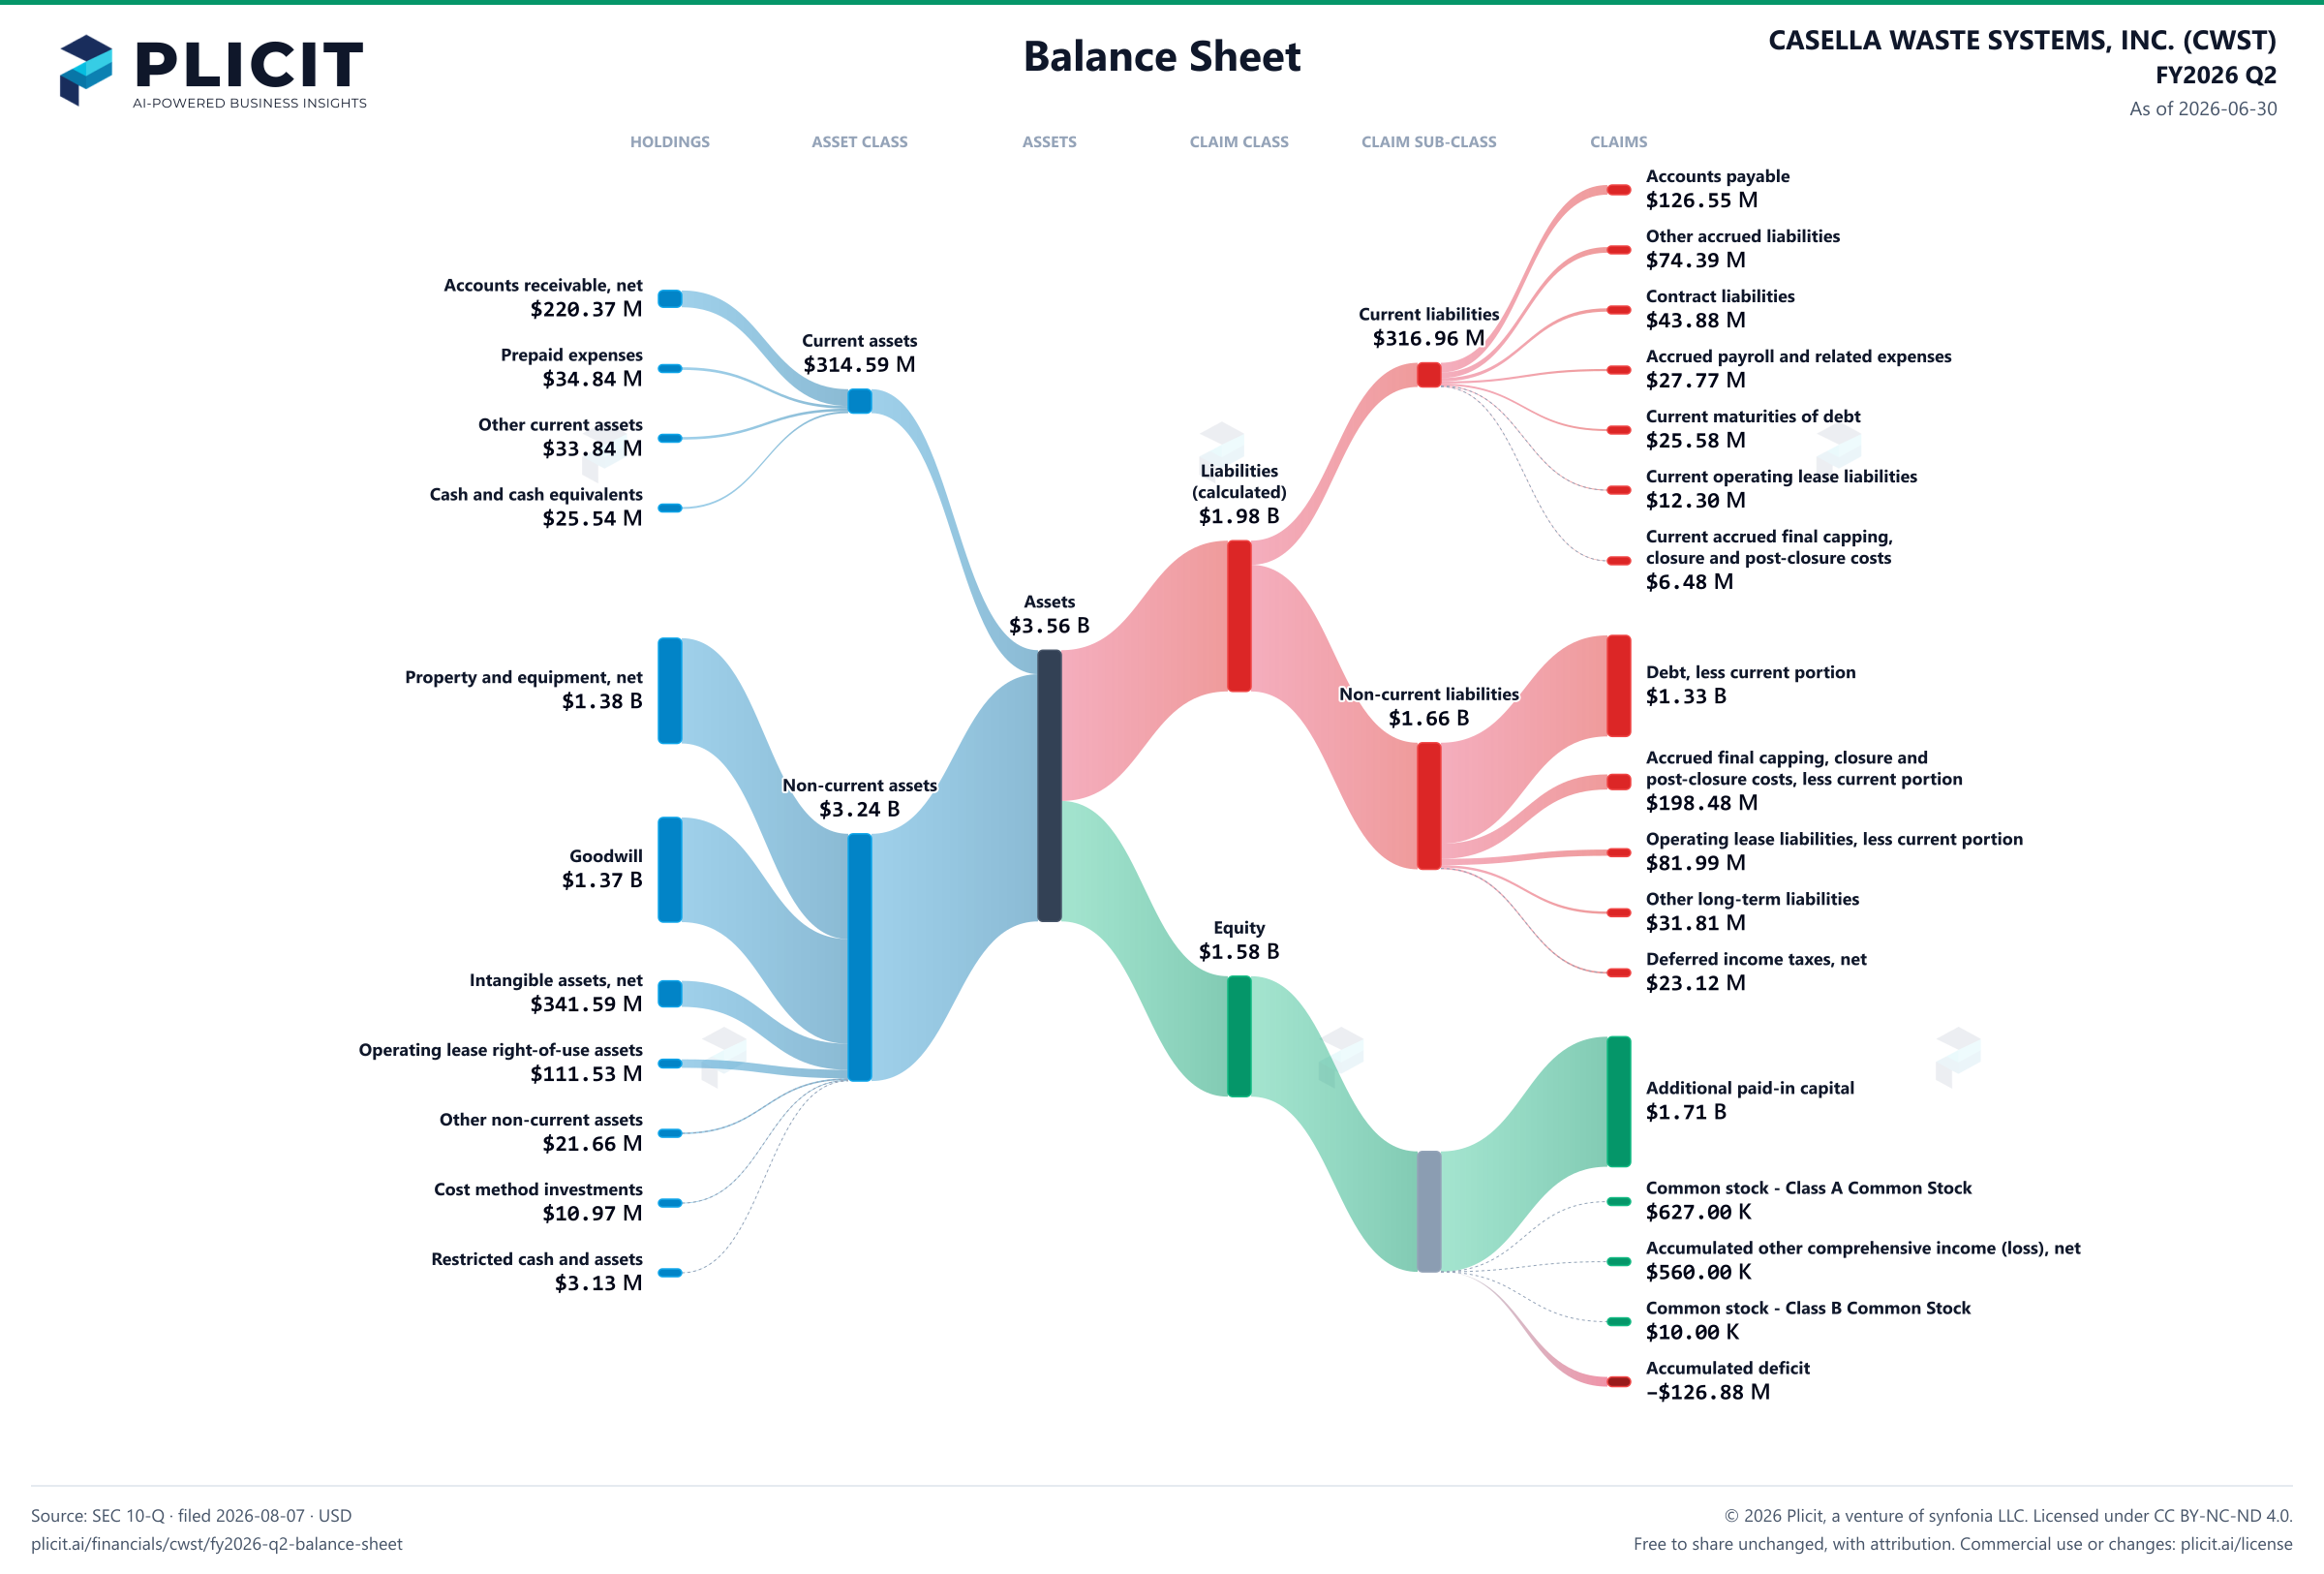
Free to share unchanged, with credit to Plicit.ai · CC BY-NC-ND 4.0Download PNG
Product waitlist
Health Check and Teardown for your own company
A health check uncovers insights of your private books, not a public ticker. Join this list to get notified as soon as we go-live!