
Dell Technologies Inc. (DELL) FY2027 Q2 Balance Sheet

Balance Sheet

As of 2026-07-31

Swipe to see the full flow
Dell Technologies Inc. (DELL) FY2027 Q2 Balance SheetBalance sheet as of 2026-07-31. The chart shows assets, liabilities and equity at that date.Current liabilities$83.70 BLiabilities$128.82 BCurrent assets$80.55 BAssets$127.39 BNon-current liabilities$45.12 BNon-current assets$46.85 BEquity−$1.43 BHOLDINGSASSET CLASSASSETSCLAIM CLASSCLAIM SUB-CLASSCLAIMSAccounts receivable, net of allowance of $56 and $77InventoriesShort-term financing receivables, net of allowance of $186 and $121Other current assetsCash and cash equivalentsGoodwillLong-term financing receivables, net of allowance of $128 and $92Property, plant, and equipment, netOther non-current assetsIntangible assets, netLong-term investmentsAccounts payableShort-term deferred revenueAccrued and otherShort-term debtLong-term debtLong-term deferred revenueOther non-current liabilitiesRetained earningsCommon stock and capital in excess of $0.01 par valueTreasury stock at costAccumulated other comprehensive lossCurrent assetsNon-current assetsAssetsCurrent liabilitiesNon-current liabilitiesLiabilitiesEquityCurrent liabilitiesCurrent liabilities$83.70 BLiabilitiesLiabilities$128.82 BCurrent assetsCurrent assets$80.55 BAccounts payableAccounts payable$49.72 BAccounts receivable, net of allowance of $56 and $77Accounts receivable, net of allowance of $56 and $77$22.92 BInventoriesInventories$21.29 BShort-term deferred revenueShort-term deferred revenue$14.76 BAssetsAssets$127.39 BShort-term financing receivables, net of allowance of $186 and $121Short-term financing receivables, net$12.81 BAccrued and otherAccrued and other$10.74 BOther current assetsOther current assets$11.97 BShort-term debtShort-term debt$8.48 BNon-current liabilitiesNon-current liabilities$45.12 BCash and cash equivalentsCash and cash equivalents$11.57 BLong-term debtLong-term debt$25.99 BGoodwillGoodwill$19.45 BLong-term deferred revenueLong-term deferred revenue$14.96 BNon-current assetsNon-current assets$46.85 BLong-term financing receivables, net of allowance of $128 and $92Long-term financing receivables, net$7.63 BOther non-current liabilitiesOther non-current liabilities$4.18 BProperty, plant, and equipment, netProperty, plant, and equipment, net$7.42 BRetained earningsRetained earnings$10.07 BOther non-current assetsOther non-current assets$5.33 BEquityEquity−$1.43 BCommon stock and capital in excess of $0.01 par valueCommon stock and capital in excess of $0.01 par value$9.28 BIntangible assets, netIntangible assets, net$4.35 BTreasury stock at costTreasury stock at cost−$20.01 BLong-term investmentsLong-term investments$2.68 BAccumulated other comprehensive lossAccumulated other comprehensive loss−$759.00 M
Chart details

Dell Technologies Inc. (DELL) FY2027 Q2 Balance Sheet

Balance sheet as of 2026-07-31. The chart shows assets, liabilities and equity at that date.

Assets
127,393,000,000 US dollars
Current assets
80,547,000,000 US dollars
Non-current assets
46,846,000,000 US dollars
Liabilities
128,820,000,000 US dollars
Current liabilities
83,703,000,000 US dollars
Non-current liabilities
45,117,000,000 US dollars
Equity
negative 1,427,000,000 US dollars
Accounts receivable, net of allowance of $56 and $77
22,918,000,000 US dollars
Inventories
21,290,000,000 US dollars
Short-term financing receivables, net of allowance of $186 and $121
12,805,000,000 US dollars
Other current assets
11,965,000,000 US dollars
Cash and cash equivalents
11,569,000,000 US dollars
Goodwill
19,448,000,000 US dollars
Long-term financing receivables, net of allowance of $128 and $92
7,625,000,000 US dollars
Property, plant, and equipment, net
7,417,000,000 US dollars
Other non-current assets
5,330,000,000 US dollars
Intangible assets, net
4,347,000,000 US dollars
Long-term investments
2,679,000,000 US dollars
Accounts payable
49,723,000,000 US dollars
Short-term deferred revenue
14,761,000,000 US dollars
Accrued and other
10,738,000,000 US dollars
Short-term debt
8,481,000,000 US dollars
Long-term debt
25,985,000,000 US dollars
Long-term deferred revenue
14,957,000,000 US dollars
Other non-current liabilities
4,175,000,000 US dollars
Retained earnings
10,065,000,000 US dollars
Common stock and capital in excess of $0.01 par value
9,277,000,000 US dollars
Treasury stock at cost
negative 20,010,000,000 US dollars
Accumulated other comprehensive loss
negative 759,000,000 US dollars

Chart connections

  • Assets equal liabilities plus consolidated equity. Consolidated equity includes noncontrolling interests when reported.
  • Treasury shares and other negative equity contributions reduce equity.
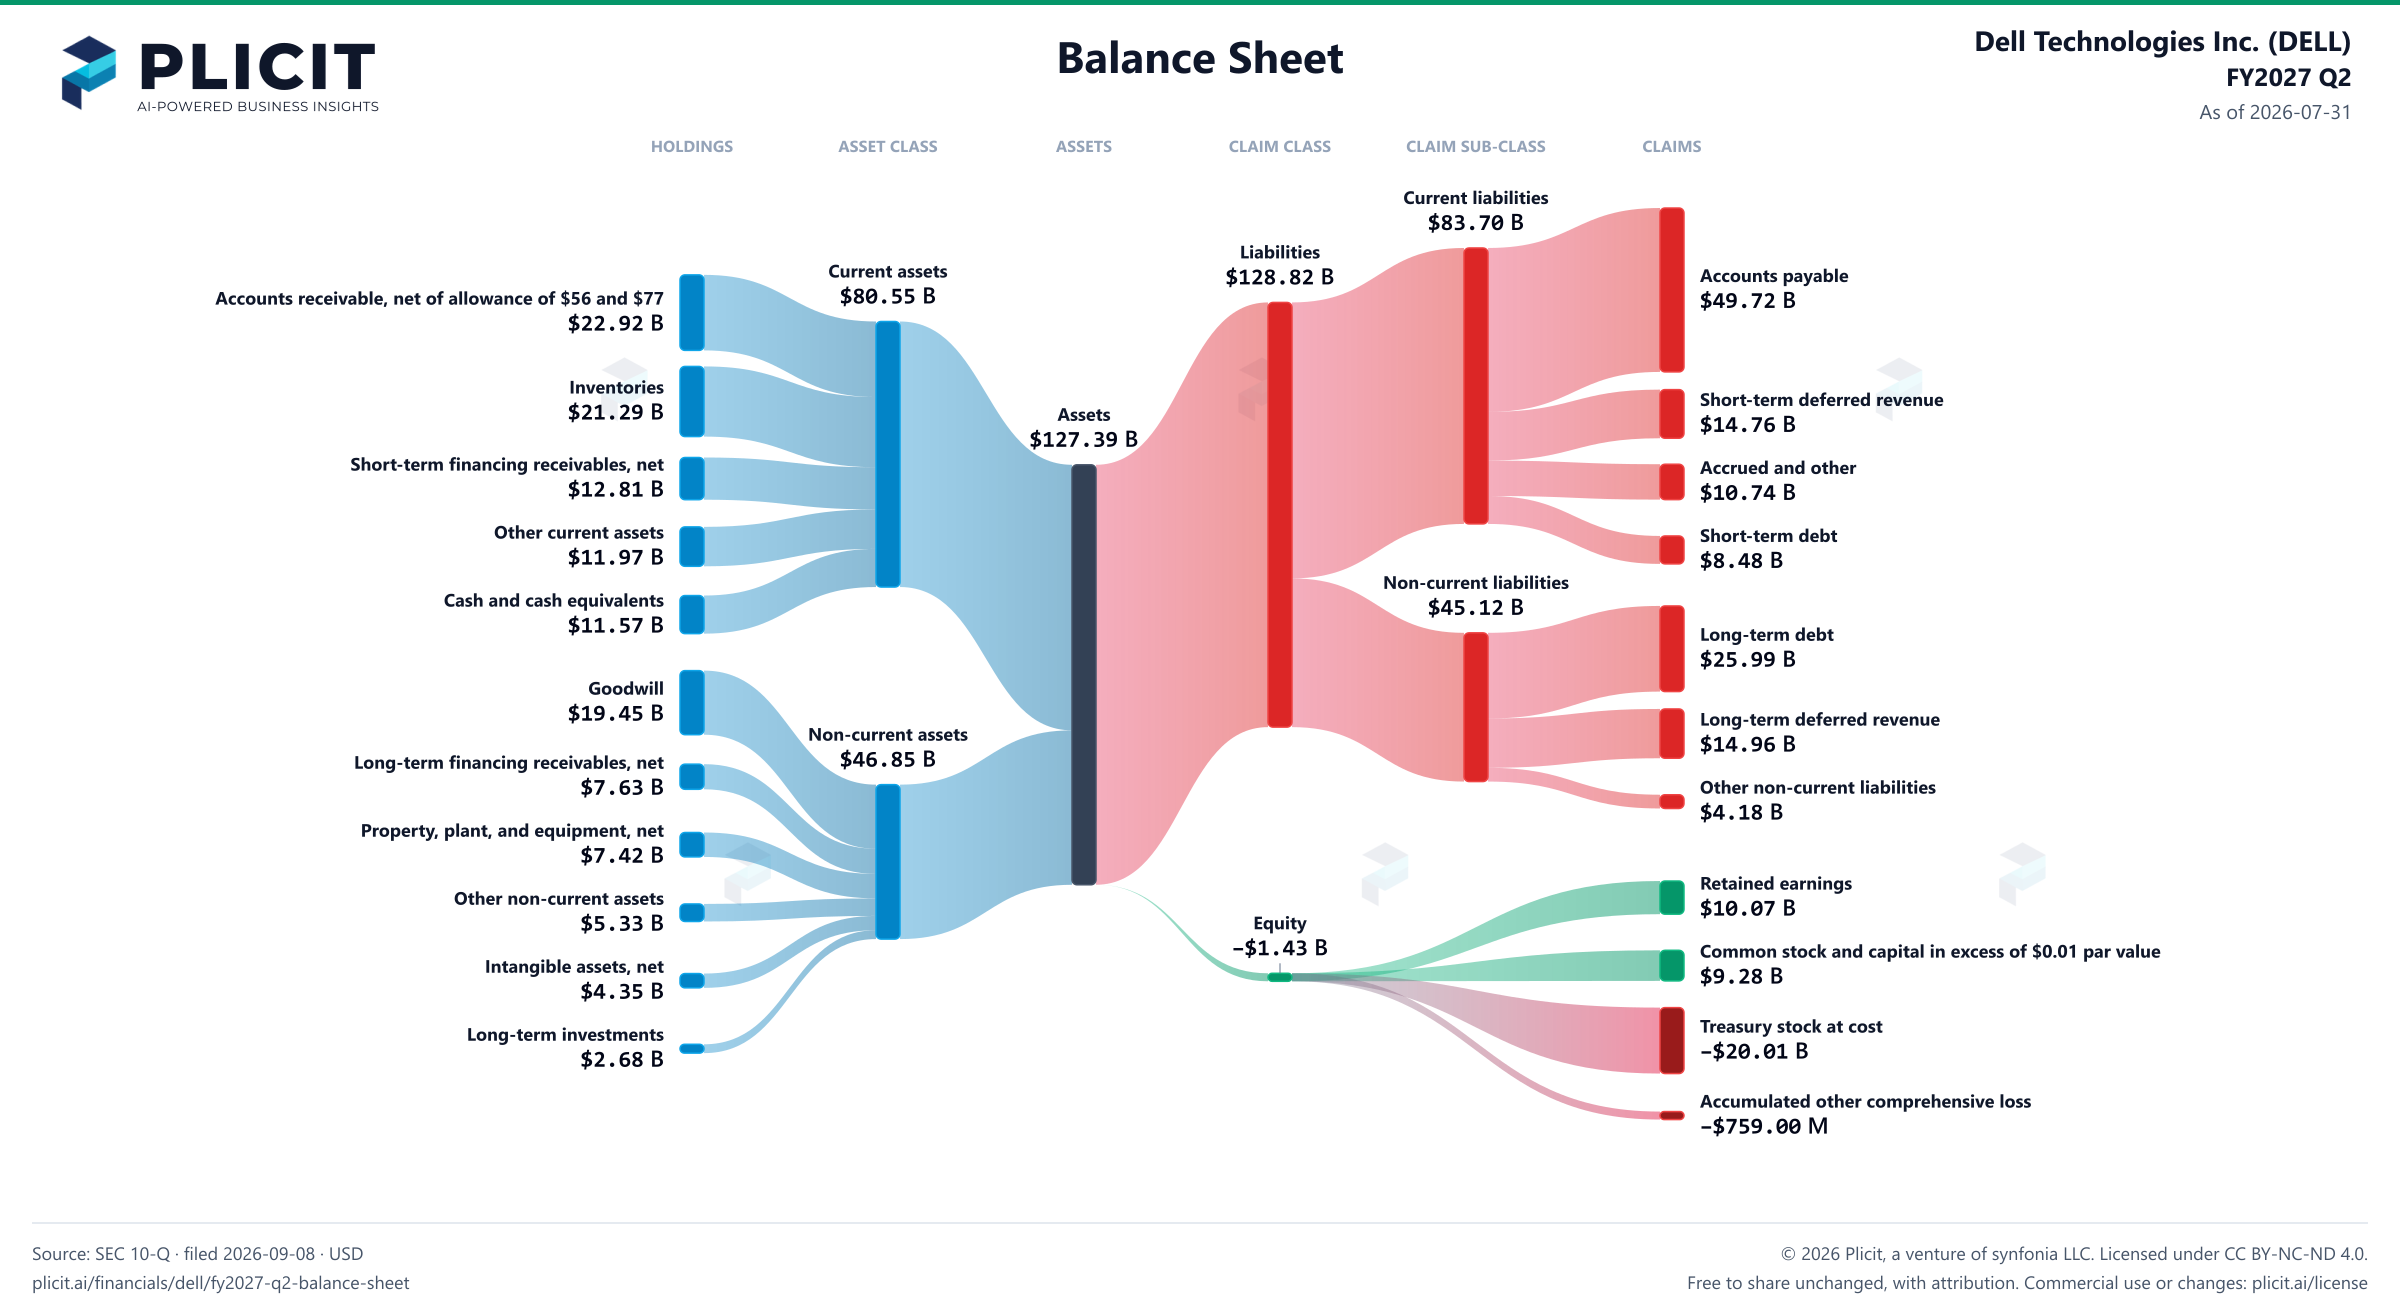
Dell Technologies Inc. (DELL) FY2027 Q2 Balance Sheet Sankey chart
Free to share unchanged, with credit to Plicit.ai · CC BY-NC-ND 4.0Download PNG

Newsletter

Get the teardowns by email

Subscribe if you want the public-company teardowns in your inbox when they're released.

Product waitlist

Health Check and Teardown for your own company

A health check uncovers insights of your private books, not a public ticker. Join this list to get notified as soon as we go-live!