
Healthpeak Properties, Inc. (DOC) FY2026 Q2 Balance Sheet

Balance Sheet

As of 2026-06-30

Swipe to see the full flow
Healthpeak Properties, Inc. (DOC) FY2026 Q2 Balance SheetBalance sheet as of 2026-06-30. The chart shows assets, liabilities and equity at that date.Liabilities$12.18 BAssets$21.68 BEquity$9.47 BGross equity(calculated)$15.60 BRedeemable noncontrolling interests$27.70 MHOLDINGSASSETSCLAIM CLASSCLAIM SUB-CLASSCLAIMSNet real estateCash and cash equivalentsOther assetsIntangible assetsInvestments in unconsolidated joint venturesRight-of-use assetLoans receivable, net of reserves of $8,165 and $11,345Deferred tax assetsRestricted cashAccounts receivable, net of allowance of $3,523 and $2,018GoodwillAssets held for saleSenior unsecured notesTerm loansBank line of credit and commercial paperDeferred revenueAccounts payable, accrued liabilities, and other liabilitiesLease liabilityIntangible liabilitiesMortgage debtLiabilities related to assets held for saleAdditional paid-in capitalPublic investors of Janus Living, Inc.Common stock, $1.00 par value: 1,500,000,000 shares authorized; 689,465,312 and 695,036,731 shares issued and outstandingNon-managing member unitholdersJoint venture partnersAccumulated other comprehensive income (loss)AssetsLiabilitiesEquityGross equity (calculated)Cumulative dividends in excess of earningsRedeemable noncontrolling interestsSenior unsecured notesSenior unsecured notes$6.79 BLiabilitiesLiabilities$12.18 BTerm loansTerm loans$1.65 BBank line of credit and commercial paperBank line of credit and commercial paper$1.50 BNet real estateNet real estate$16.86 BDeferred revenueDeferred revenue$1.03 BAccounts payable, accrued liabilities, and other liabilitiesAccounts payable, accruedliabilities, and other liabilities$678.69 MAssetsAssets$21.68 BLease liabilityLease liability$288.19 MCash and cash equivalentsCash and cash equivalents$1.63 BIntangible liabilitiesIntangible liabilities$155.47 MOther assetsOther assets$896.88 MMortgage debtMortgage debt$104.21 MIntangible assetsIntangible assets$717.49 MLiabilities related to assets held for saleLiabilities related to assets held for sale$594.00 KEquityEquity$9.47 BInvestments in unconsolidated joint venturesInvestments in unconsolidated joint ventures$526.78 MGross equity (calculated)Gross equity(calculated)$15.60 BRight-of-use assetRight-of-use asset$395.12 MLoans receivable, net of reserves of $8,165 and $11,345Loans receivable, net of reserves of $8,165 and $11,345$261.40 MAdditional paid-in capitalAdditional paid-in capital$13.27 BDeferred tax assetsDeferred tax assets$122.32 MRedeemable noncontrolling interestsRedeemable noncontrolling interests$27.70 MRestricted cashRestricted cash$91.86 MPublic investors of Janus Living, Inc.Public investors of Janus Living, Inc.$979.19 MAccounts receivable, net of allowance of $3,523 and $2,018Accounts receivable, net$72.13 MCommon stock, $1.00 par value: 1,500,000,000 shares authorized; 689,465,312 and 695,036,731 shares issued and outstandingCommon stock$689.47 MGoodwillGoodwill$68.53 MNon-managing member unitholdersNon-managing member unitholders$355.52 MAssets held for saleAssets held for sale$37.10 MJoint venture partnersJoint venture partners$291.29 MAccumulated other comprehensive income (loss)Accumulated other comprehensive income (loss)$10.53 MCumulative dividends in excess of earningsCumulative dividends in excess of earnings−$6.13 B
Chart details

Healthpeak Properties, Inc. (DOC) FY2026 Q2 Balance Sheet

Balance sheet as of 2026-06-30. The chart shows assets, liabilities and equity at that date.

Assets
21,680,046,000 US dollars
Liabilities
12,181,606,000 US dollars
Equity
9,470,745,000 US dollars
Redeemable noncontrolling interests
27,695,000 US dollars
Buildings and improvements
17,211,536,000 US dollars. Part of Net real estate, drawn as one net amount.
Development costs and construction in progress
969,495,000 US dollars. Part of Net real estate, drawn as one net amount.
Accumulated depreciation
negative 4,543,382,000 US dollars. Part of Net real estate, drawn as one net amount.
Land and improvements
3,225,957,000 US dollars. Part of Net real estate, drawn as one net amount.
Net real estate
16,863,606,000 US dollars
Cash and cash equivalents
1,626,827,000 US dollars
Other assets
896,875,000 US dollars
Intangible assets
717,494,000 US dollars
Investments in unconsolidated joint ventures
526,780,000 US dollars
Right-of-use asset
395,124,000 US dollars
Loans receivable, net of reserves of $8,165 and $11,345
261,398,000 US dollars
Deferred tax assets
122,320,000 US dollars
Restricted cash
91,858,000 US dollars
Accounts receivable, net of allowance of $3,523 and $2,018
72,134,000 US dollars
Goodwill
68,529,000 US dollars
Assets held for sale
37,101,000 US dollars
Senior unsecured notes
6,785,697,000 US dollars
Term loans
1,646,282,000 US dollars
Bank line of credit and commercial paper
1,495,994,000 US dollars
Deferred revenue
1,026,479,000 US dollars
Accounts payable, accrued liabilities, and other liabilities
678,687,000 US dollars
Lease liability
288,194,000 US dollars
Intangible liabilities
155,466,000 US dollars
Mortgage debt
104,213,000 US dollars
Liabilities related to assets held for sale
594,000 US dollars
Additional paid-in capital
13,273,880,000 US dollars
Public investors of Janus Living, Inc.
979,186,000 US dollars
Common stock, $1.00 par value: 1,500,000,000 shares authorized; 689,465,312 and 695,036,731 shares issued and outstanding
689,465,000 US dollars
Non-managing member unitholders
355,515,000 US dollars
Joint venture partners
291,294,000 US dollars
Accumulated other comprehensive income (loss)
10,534,000 US dollars
Cumulative dividends in excess of earnings
negative 6,129,129,000 US dollars
Gross equity (calculated)
15,599,874,000 US dollars. Net equity plus the magnitudes of its negative contributions equals gross positive equity. The negative contributions enter this reconciliation as add-backs; their filed signs stay negative.

Chart connections

  • Assets equal liabilities plus temporary equity plus consolidated equity. Consolidated equity includes noncontrolling interests when reported.
  • Treasury shares and other negative equity contributions reduce equity.
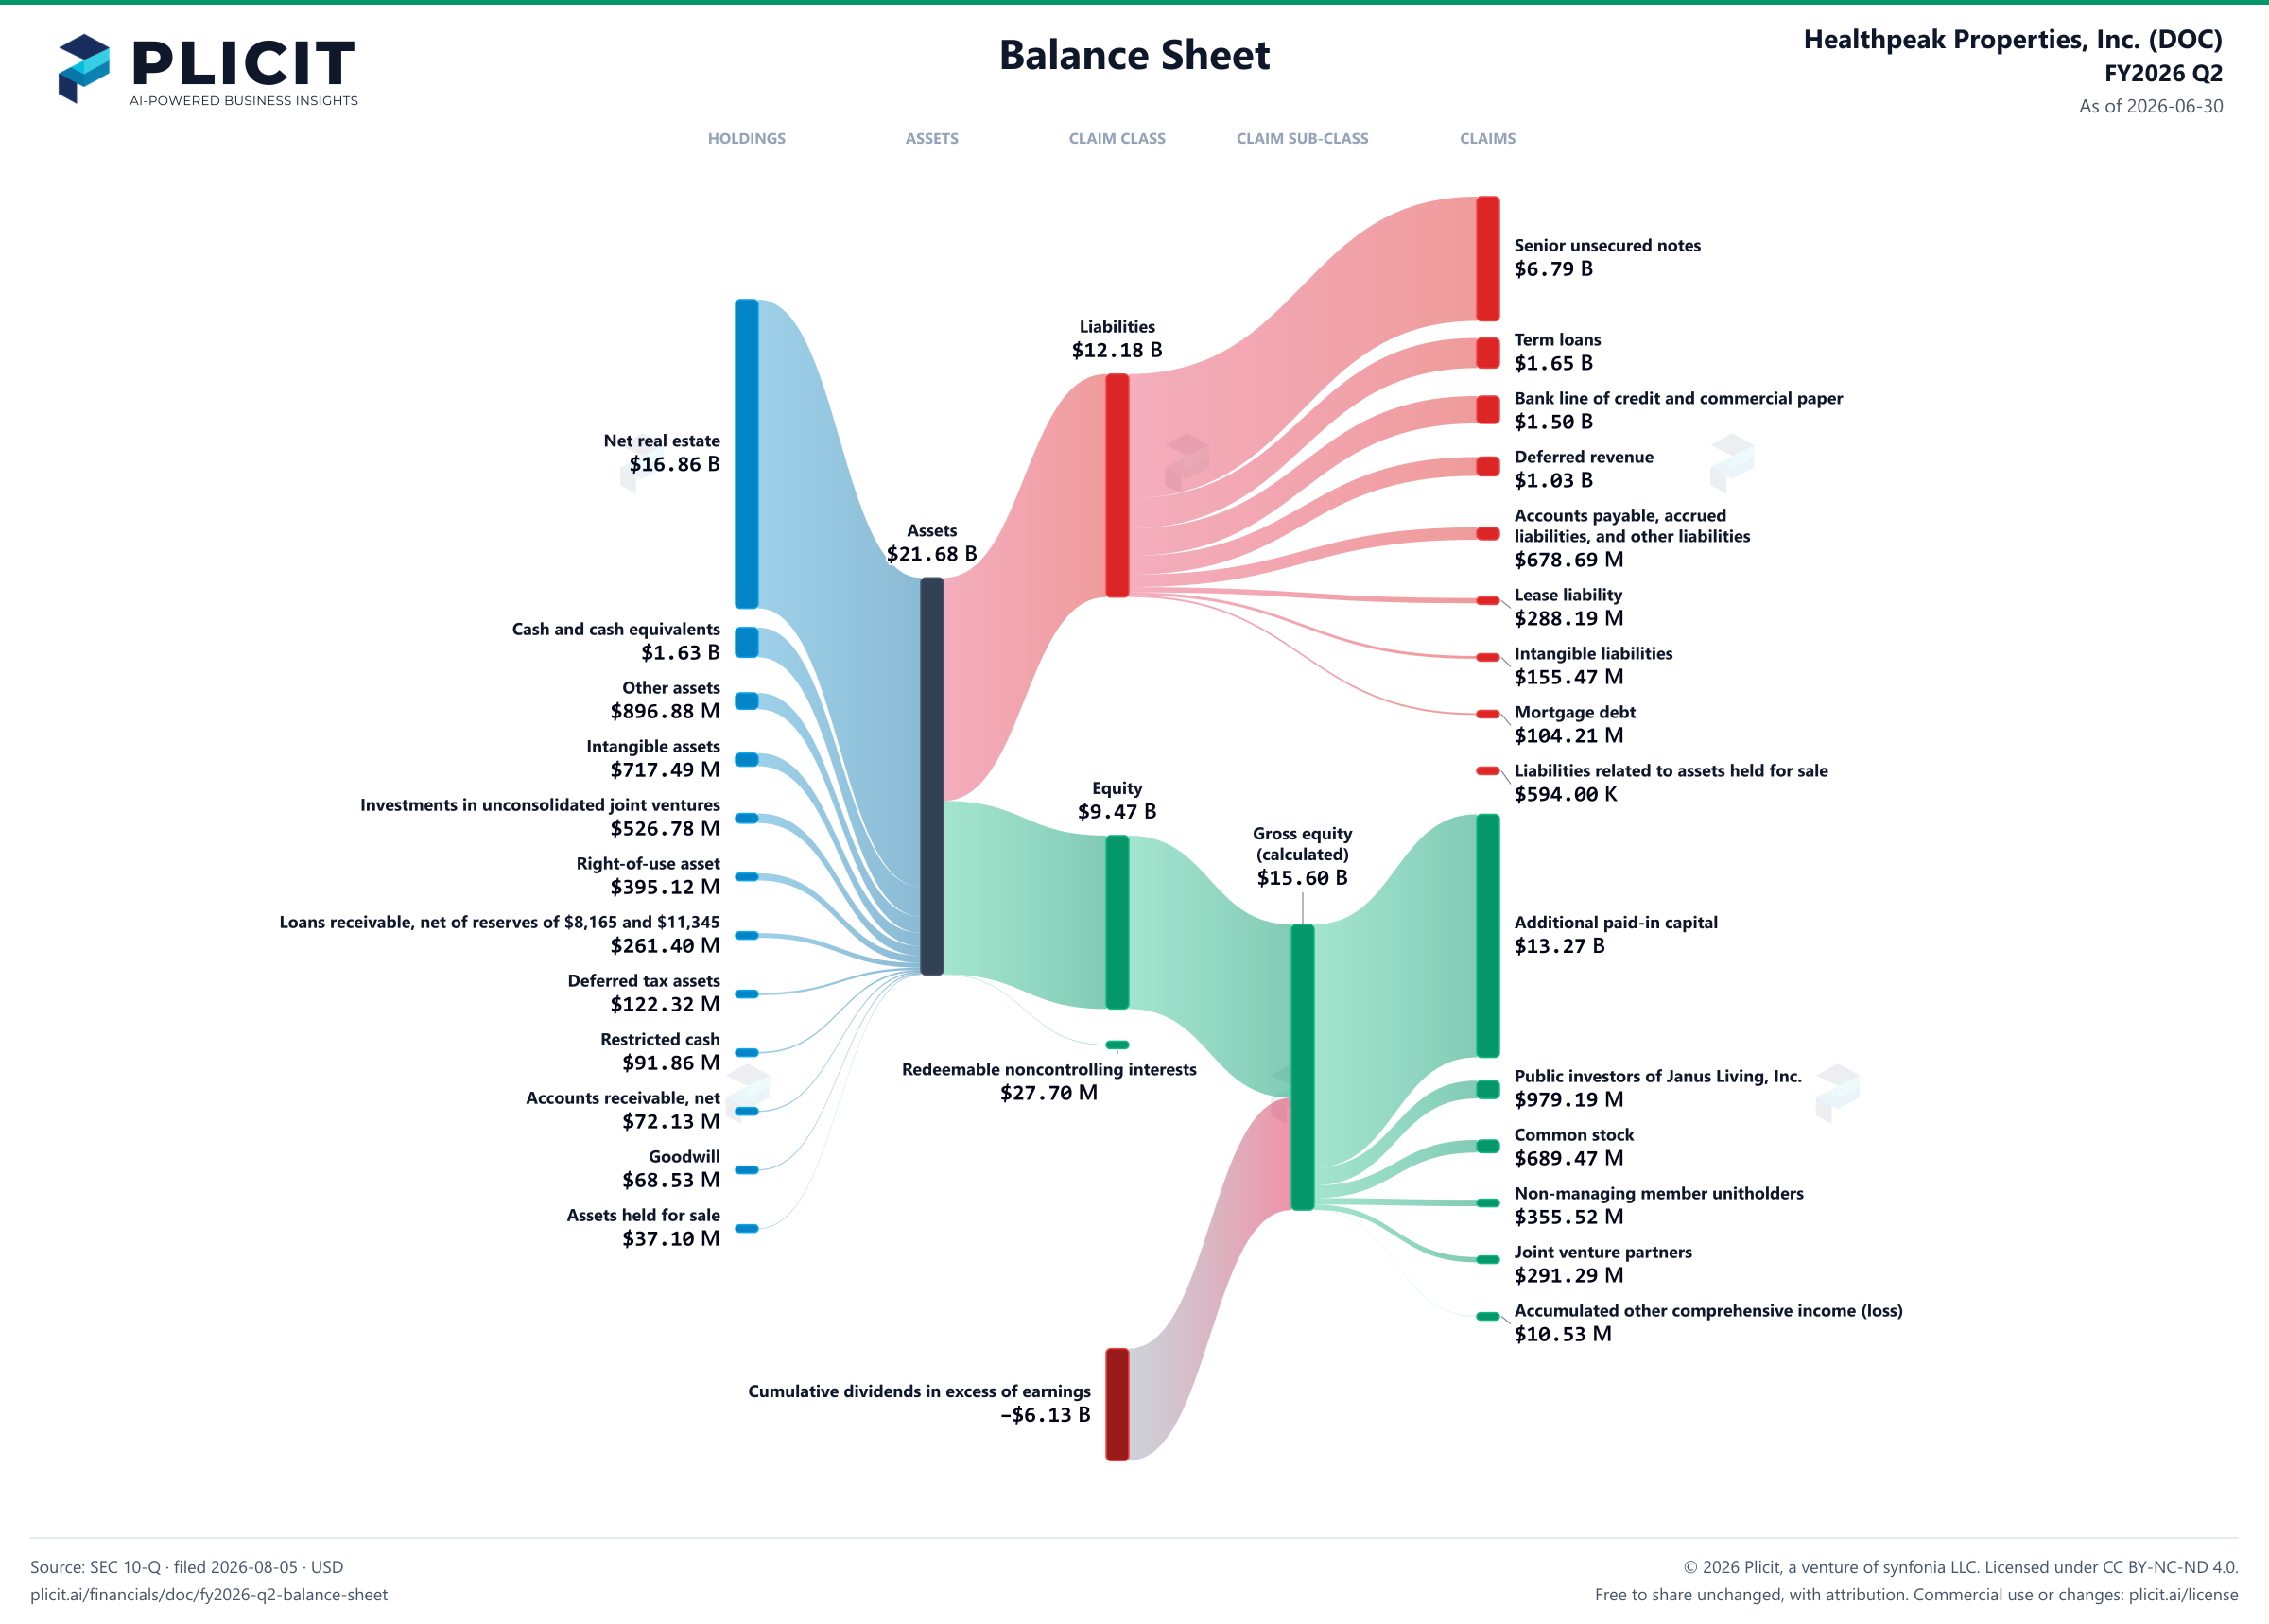
Healthpeak Properties, Inc. (DOC) FY2026 Q2 Balance Sheet Sankey chart
Free to share unchanged, with credit to Plicit.ai · CC BY-NC-ND 4.0Download PNG

Newsletter

Get the teardowns by email

Subscribe if you want the public-company teardowns in your inbox when they're released.

Product waitlist

Health Check and Teardown for your own company

A health check uncovers insights of your private books, not a public ticker. Join this list to get notified as soon as we go-live!