
DISTRIBUTION SOLUTIONS GROUP, INC. (DSGR) FY2026 Q2 Balance Sheet

Published Source: Form 10-Q on SEC EDGAR filed (opens in a new tab)

As of 2026-06-30

Balance Sheet

Swipe to see the full flow
DISTRIBUTION SOLUTIONS GROUP, INC. (DSGR) FY2026 Q2 Balance SheetBalance sheet as of 2026-06-30. The chart shows assets, liabilities and equity at that date.Current assets$831.80 MCurrent liabilities$326.85 MLiabilities$1.16 BAssets$1.82 BNon-current liabilities$835.72 MNon-current assets$985.49 MEquity$654.72 MHOLDINGSASSET CLASSASSETSCLAIM CLASSCLAIM SUB-CLASSCLAIMSInventoriesAccounts receivable, less allowances of $8,027 and $6,472, respectivelyCash and cash equivalentsPrepaid expenses and other current assetsRestricted cashGoodwillIntangible assets, net - Customer relationshipsProperty, plant and equipment, netRight of use operating lease assetsIntangible assets, net - Trade names and other intangibles, netRental equipment, netCash value of life insuranceOther assetsDeferred tax asset, netAccounts payableAccrued expenses and other current liabilitiesCurrent portion of long-term debtCurrent portion of lease liabilitiesLong-term debt, less current portion, netLease liabilitiesOther liabilitiesDeferred tax liability, netCapital in excess of par valueCommon stock, $1 par value: Authorized - 70,000,000 shares Issued - and 47,860,312 shares, respectively Outstanding - and 46,180,700 shares, respectivelyTreasury stock – 1,685,772 and 1,679,612 shares, respectivelyRetained deficitAccumulated other comprehensive income (loss)Current assetsNon-current assetsAssetsCurrent liabilitiesNon-current liabilitiesLiabilitiesEquityEquityInventoriesInventories$378.73 MCurrent assetsCurrent assets$831.80 MAccounts payableAccounts payable$188.12 MAccounts receivable, less allowances of $8,027 and $6,472, respectivelyAccounts receivable, net$331.65 MCurrent liabilitiesCurrent liabilities$326.85 MAccrued expenses and other current liabilitiesAccrued expenses and other current liabilities$81.56 MCash and cash equivalentsCash and cash equivalents$66.94 MCurrent portion of long-term debtCurrent portion of long-term debt$35.84 MLiabilitiesLiabilities$1.16 BPrepaid expenses and other current assetsPrepaid expenses and other current assets$45.94 MCurrent portion of lease liabilitiesCurrent portion of lease liabilities$21.33 MRestricted cashRestricted cash$8.54 MAssetsAssets$1.82 BNon-current liabilitiesNon-current liabilities$835.72 MLong-term debt, less current portion, netLong-term debt, less current portion, net$693.66 MGoodwillGoodwill$473.66 MLease liabilitiesLease liabilities$94.64 MOther liabilitiesOther liabilities$26.53 MIntangible assets, net - Customer relationshipsIntangible assets, net - Customer relationships$131.40 MDeferred tax liability, netDeferred tax liability, net$20.89 MProperty, plant and equipment, netProperty, plant and equipment, net$124.38 MNon-current assetsNon-current assets$985.49 MEquityEquity$654.72 MRight of use operating lease assetsRight of use operating lease assets$107.61 MCapital in excess of par valueCapital in excess of par value$690.71 MIntangible assets, net - Trade names and other intangibles, netIntangible assets, net - Tradenames and other intangibles, net$75.00 MCommon stock, $1 par value: Authorized - 70,000,000 shares Issued - and 47,860,312 shares, respectively Outstanding - and 46,180,700 shares, respectivelyCommon stock$46.24 MRental equipment, netRental equipment, net$42.12 MTreasury stock – 1,685,772 and 1,679,612 shares, respectivelyBought back (treasury stock)−$44.16 MCash value of life insuranceCash value of life insurance$22.74 MRetained deficitAccumulated deficit−$24.82 MAccumulated other comprehensive income (loss)Other comprehensive loss−$13.25 MOther assetsOther assets$7.45 MDeferred tax asset, netDeferred tax asset, net$1.13 M
Chart details

DISTRIBUTION SOLUTIONS GROUP, INC. (DSGR) FY2026 Q2 Balance Sheet

Balance sheet as of 2026-06-30. The chart shows assets, liabilities and equity at that date.

Assets
1,817,291,000 US dollars
Current assets
831,801,000 US dollars
Non-current assets
985,490,000 US dollars
Liabilities
1,162,576,000 US dollars
Current liabilities
326,853,000 US dollars
Non-current liabilities
835,723,000 US dollars
Equity
654,715,000 US dollars
Inventories
378,734,000 US dollars
Accounts receivable, less allowances of $8,027 and $6,472, respectively
331,649,000 US dollars
Cash and cash equivalents
66,938,000 US dollars
Prepaid expenses and other current assets
45,938,000 US dollars
Restricted cash
8,542,000 US dollars
Goodwill
473,663,000 US dollars
Intangible assets, net - Customer relationships
131,403,000 US dollars
Property, plant and equipment, net
124,376,000 US dollars
Right of use operating lease assets
107,605,000 US dollars
Intangible assets, net - Trade names and other intangibles, net
75,000,000 US dollars
Rental equipment, net
42,123,000 US dollars
Cash value of life insurance
22,738,000 US dollars
Other assets
7,450,000 US dollars
Deferred tax asset, net
1,132,000 US dollars
Accounts payable
188,115,000 US dollars
Accrued expenses and other current liabilities
81,564,000 US dollars
Current portion of long-term debt
35,840,000 US dollars
Current portion of lease liabilities
21,334,000 US dollars
Long-term debt, less current portion, net
693,658,000 US dollars
Lease liabilities
94,641,000 US dollars
Other liabilities
26,534,000 US dollars
Deferred tax liability, net
20,890,000 US dollars
Capital in excess of par value
690,706,000 US dollars
Common stock, $1 par value: Authorized - 70,000,000 shares Issued - and 47,860,312 shares, respectively Outstanding - and 46,180,700 shares, respectively
46,238,000 US dollars
Preferred stock, $1 par value: Authorized - 500,000 shares, issued and outstanding — None
0 US dollars
Treasury stock – 1,685,772 and 1,679,612 shares, respectively
negative 44,159,000 US dollars
Retained deficit
negative 24,818,000 US dollars
Accumulated other comprehensive income (loss)
negative 13,252,000 US dollars

Chart connections

  • Assets equal liabilities plus consolidated equity. Consolidated equity includes noncontrolling interests when reported.
  • Treasury shares and other negative equity contributions reduce equity.
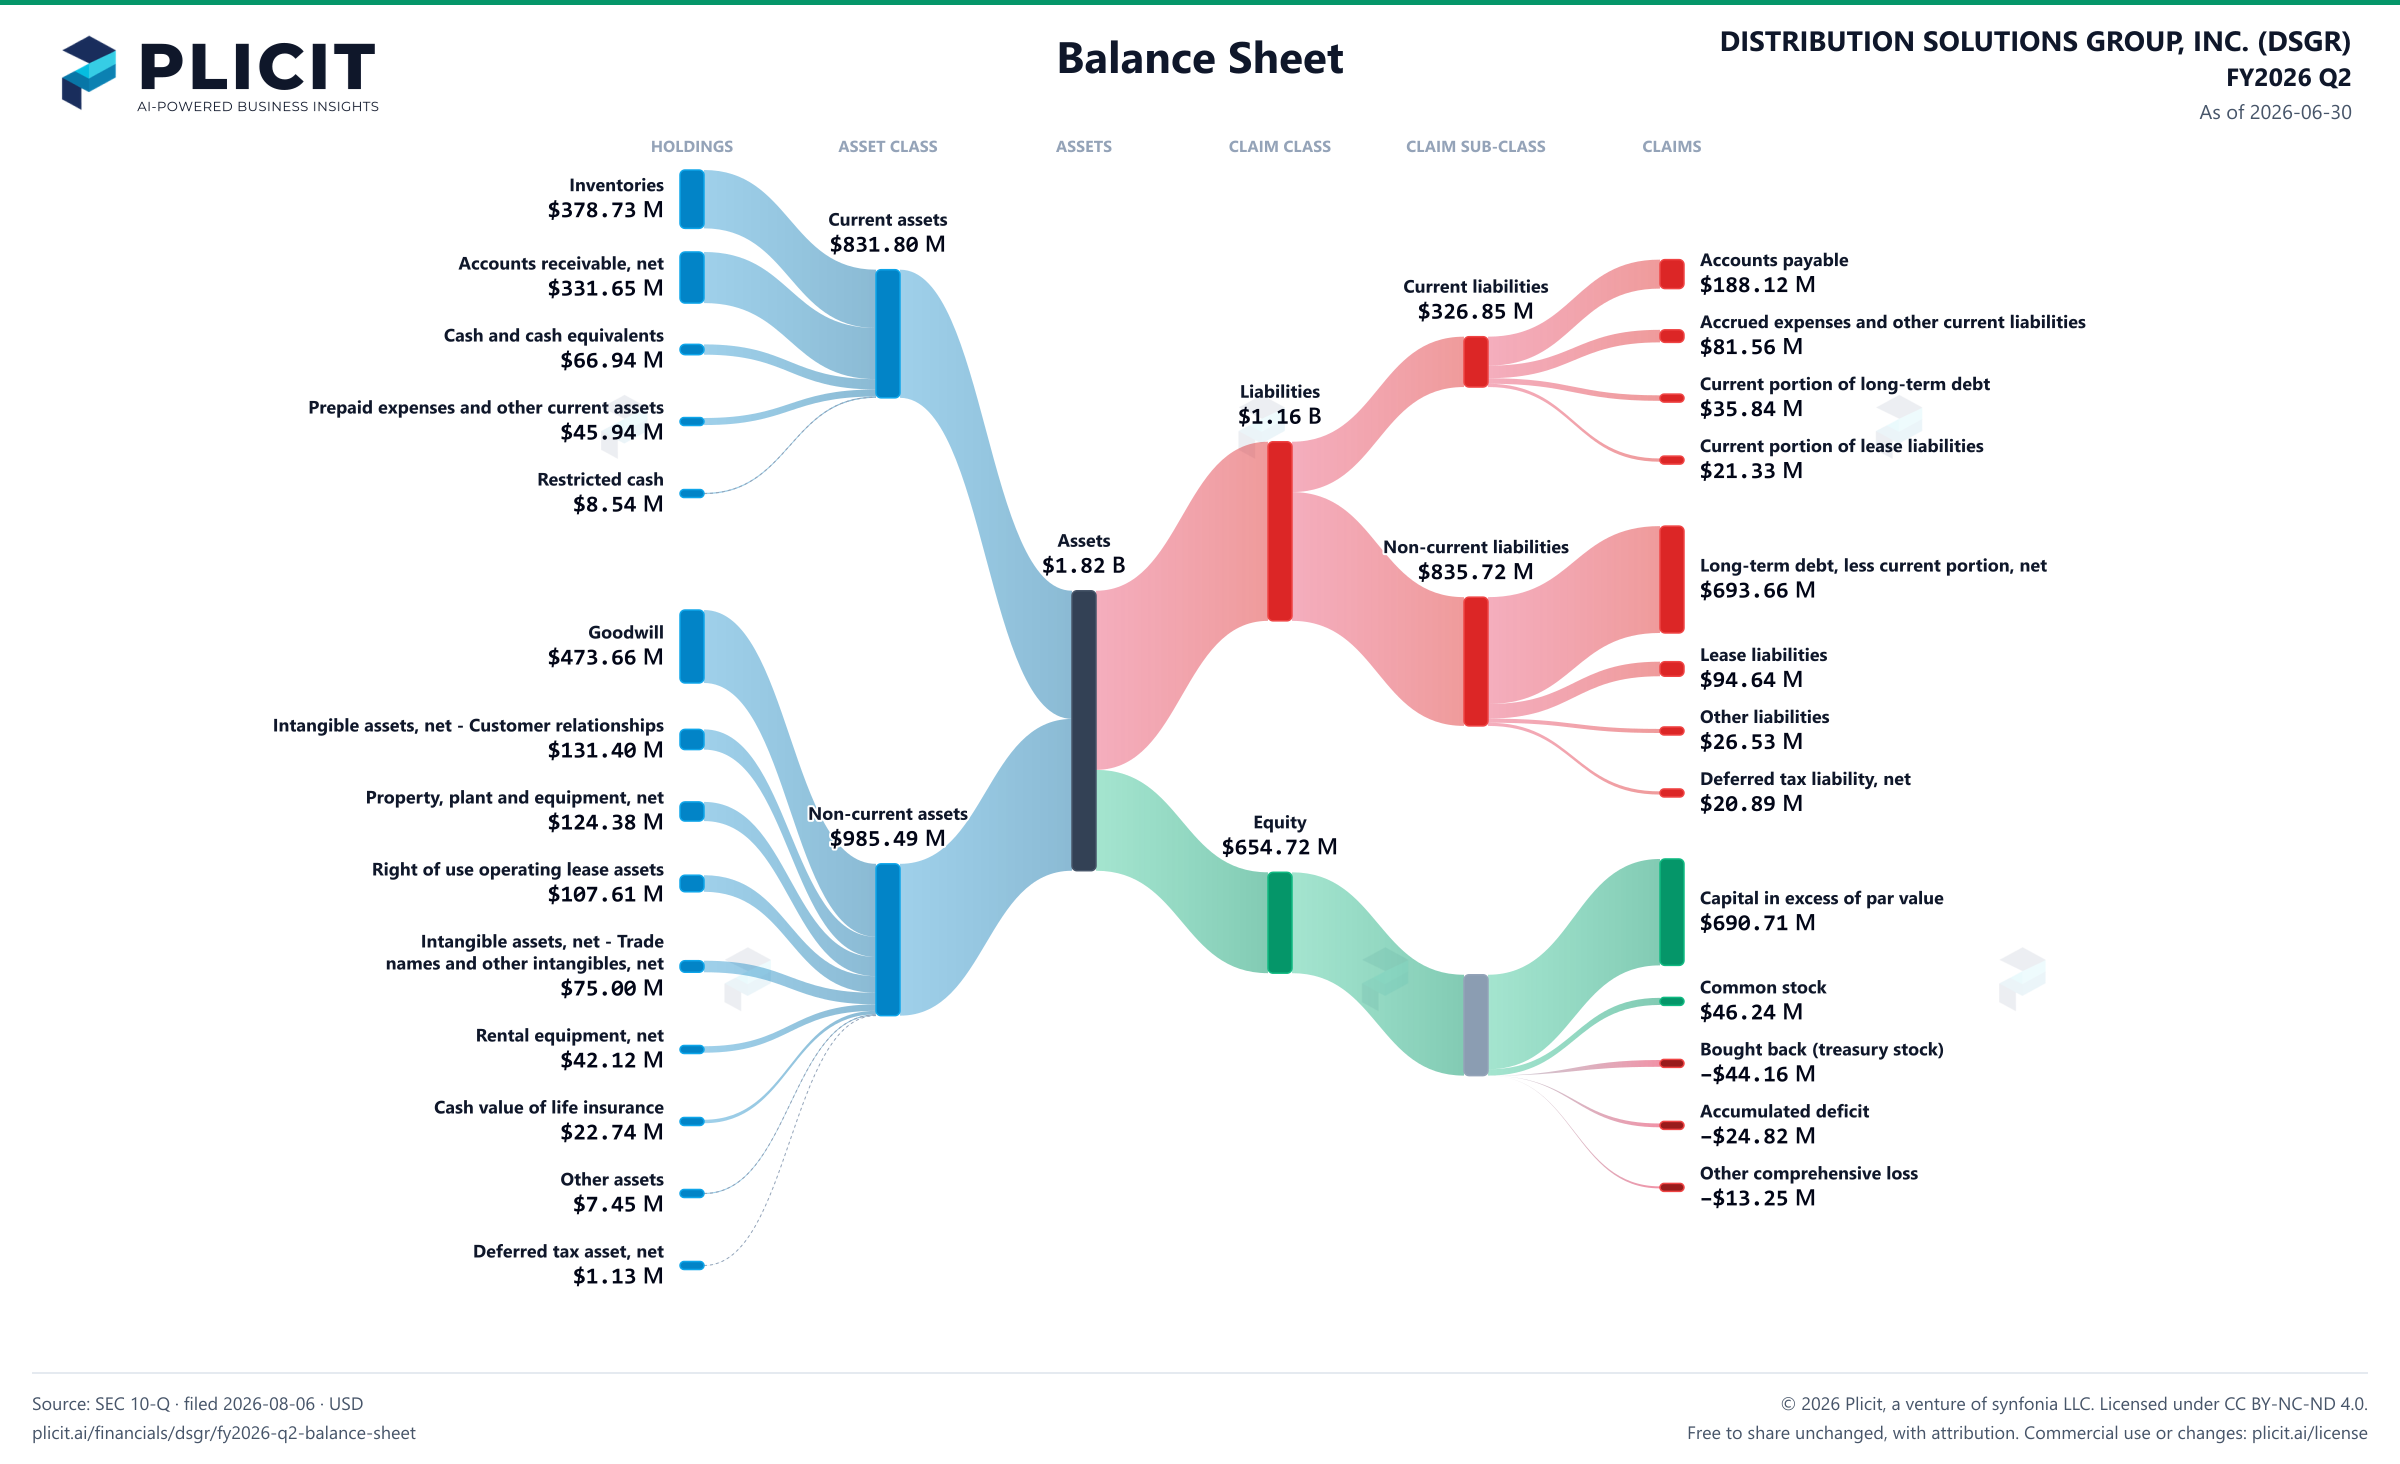
DISTRIBUTION SOLUTIONS GROUP, INC. (DSGR) FY2026 Q2 Balance Sheet Sankey chart
Free to share unchanged, with credit to Plicit.ai · CC BY-NC-ND 4.0Download PNG

Product waitlist

Health Check and Teardown for your own company

A health check uncovers insights of your private books, not a public ticker. Join this list to get notified as soon as we go-live!