
Consolidated Edison, Inc. (ED) FY2025 Q1 Balance Sheet

Balance Sheet

As of 2025-03-31

Swipe to see the full flow
Consolidated Edison, Inc. (ED) FY2025 Q1 Balance SheetBalance sheet as of 2025-03-31. The chart shows assets, liabilities and equity at that date.Current assets$6.13 BCurrent liabilities$4.78 BAssets$70.69 BLiabilities(calculated)$46.91 BNon-current liabilities$42.13 BNon-current assets$64.56 BEquity$23.78 BHOLDINGSASSET CLASSASSETSCLAIM CLASSCLAIM SUB-CLASSCLAIMSAccounts receivable – customers, net allowance for uncollectible accounts of $616 and $620 in 2025 and 2024, respectivelyPrepaymentsAccrued unbilled revenueFuel oil, gas in storage, materials and supplies, at average costCash and temporary cash investmentsOther receivables, net allowance for uncollectible accounts of $28 and $41 in 2025 and 2024, respectivelyRegulatory assetsRevenue decoupling mechanism receivableOther current assetsTaxes receivableFair value of derivative assetsNetRegulatory assetsPension and retiree benefitsConstruction work in progressINVESTMENTSOperating lease right-of-use assetGoodwillOther deferred charges and noncurrent assetsFair value of derivative assetsNon-utility property, net accumulated depreciation of $25 in 2025 and 2024Construction work in progressAccounts payableTerm loanSystem benefit chargeCustomer depositsOther current liabilitiesNotes payableAccrued interestRegulatory liabilitiesFair value of derivative liabilitiesAccrued wagesOperating lease liabilitiesAccrued taxesLONG-TERM DEBTDeferred income taxes and unamortized investment tax creditsRegulatory liabilitiesSuperfund and other environmental costsPensions and retiree benefitsOther deferred credits and noncurrent liabilitiesAsset retirement obligationsOperating lease liabilitiesProvision for injuries and damagesFair value of derivative liabilitiesCommon shareholders’ equityCurrent assetsNon-current assetsAssetsCurrent liabilitiesNon-current liabilitiesLiabilities (calculated)EquityAccounts receivable – customers, net allowance for uncollectible accounts of $616 and $620 in 2025 and 2024, respectivelyAccounts receivable – customers$2.75 BAccounts payableAccounts payable$1.45 BPrepaymentsPrepayments$999.00 MTerm loanTerm loan$700.00 MAccrued unbilled revenueAccrued unbilled revenue$539.00 MSystem benefit chargeSystem benefit charge$438.00 MFuel oil, gas in storage, materials and supplies, at average costFuel oil, gas in storage, materialsand supplies, at average cost$467.00 MCustomer depositsCustomer deposits$395.00 MOther current liabilitiesOther current liabilities$375.00 MCurrent assetsCurrent assets$6.13 BCash and temporary cash investmentsCash and temporary cash investments$360.00 MCurrent liabilitiesCurrent liabilities$4.78 BNotes payableNotes payable$350.00 MOther receivables, net allowance for uncollectible accounts of $28 and $41 in 2025 and 2024, respectivelyOther receivables$265.00 MAccrued interestAccrued interest$336.00 MRegulatory assetsRegulatory assets$207.00 MRegulatory liabilitiesRegulatory liabilities$213.00 MRevenue decoupling mechanism receivableRevenue decoupling mechanism receivable$176.00 MFair value of derivative liabilitiesFair value of derivative liabilities$184.00 MOther current assetsOther current assets$155.00 MAssetsAssets$70.69 BAccrued wagesAccrued wages$137.00 MLiabilities (calculated)Liabilities(calculated)$46.91 BTaxes receivableTaxes receivable$119.00 MOperating lease liabilitiesOperating lease liabilities$119.00 MFair value of derivative assetsFair value of derivative assets$97.00 MAccrued taxesAccrued taxes$83.00 MLONG-TERM DEBTLONG-TERM DEBT$24.65 BNetNet$49.62 BDeferred income taxes and unamortized investment tax creditsDeferred income taxes andunamortized investment tax credits$9.16 BNon-current liabilitiesNon-current liabilities$42.13 BNon-current assetsNon-current assets$64.56 BRegulatory liabilitiesRegulatory liabilities$5.00 BRegulatory assetsRegulatory assets$5.58 BSuperfund and other environmental costsSuperfund and other environmental costs$1.03 BPension and retiree benefitsPension and retiree benefits$3.76 BPensions and retiree benefitsPensions and retiree benefits$560.00 MConstruction work in progressConstruction work in progress$3.18 BOther deferred credits and noncurrent liabilitiesOther deferred credits and noncurrent liabilities$550.00 MINVESTMENTSINVESTMENTS$1.14 BAsset retirement obligationsAsset retirement obligations$458.00 MOperating lease right-of-use assetOperating lease right-of-use asset$489.00 MOperating lease liabilitiesOperating lease liabilities$394.00 MGoodwillGoodwill$408.00 MProvision for injuries and damagesProvision for injuries and damages$184.00 MOther deferred charges and noncurrent assetsOther deferred charges and noncurrent assets$339.00 MFair value of derivative liabilitiesFair value of derivative liabilities$136.00 MEquityEquity$23.78 BFair value of derivative assetsFair value of derivative assets$36.00 MCommon shareholders’ equityCommon shareholders’ equity$23.78 BNon-utility property, net accumulated depreciation of $25 in 2025 and 2024Non-utility property$12.00 MConstruction work in progressConstruction work in progress$1.00 M
Chart details

Consolidated Edison, Inc. (ED) FY2025 Q1 Balance Sheet

Balance sheet as of 2025-03-31. The chart shows assets, liabilities and equity at that date.

Assets
70,691,000,000 US dollars
Current assets
6,133,000,000 US dollars
Non-current assets
64,558,000,000 US dollars
Liabilities (calculated)
46,908,000,000 US dollars
Current liabilities
4,780,000,000 US dollars
Non-current liabilities
42,128,000,000 US dollars
Equity
23,783,000,000 US dollars
Utility plant, at original cost - Electric
41,872,000,000 US dollars. Part of Net, drawn as one net amount.
Utility plant, at original cost - Gas
15,283,000,000 US dollars. Part of Net, drawn as one net amount.
Utility plant, at original cost - Steam
3,185,000,000 US dollars. Part of Net, drawn as one net amount.
General
4,936,000,000 US dollars. Part of Net, drawn as one net amount.
Less: Accumulated depreciation
negative 15,659,000,000 US dollars. Part of Net, drawn as one net amount.
Accounts receivable – customers, net allowance for uncollectible accounts of $616 and $620 in 2025 and 2024, respectively
2,749,000,000 US dollars
Prepayments
999,000,000 US dollars
Accrued unbilled revenue
539,000,000 US dollars
Fuel oil, gas in storage, materials and supplies, at average cost
467,000,000 US dollars
Cash and temporary cash investments
360,000,000 US dollars
Other receivables, net allowance for uncollectible accounts of $28 and $41 in 2025 and 2024, respectively
265,000,000 US dollars
Regulatory assets
207,000,000 US dollars
Revenue decoupling mechanism receivable
176,000,000 US dollars
Other current assets
155,000,000 US dollars
Taxes receivable
119,000,000 US dollars
Fair value of derivative assets
97,000,000 US dollars
Assets held for sale
0 US dollars
Net
49,617,000,000 US dollars
Regulatory assets
5,582,000,000 US dollars
Pension and retiree benefits
3,755,000,000 US dollars
Construction work in progress
3,183,000,000 US dollars
INVESTMENTS
1,136,000,000 US dollars
Operating lease right-of-use asset
489,000,000 US dollars
Goodwill
408,000,000 US dollars
Other deferred charges and noncurrent assets
339,000,000 US dollars
Fair value of derivative assets
36,000,000 US dollars
Non-utility property, net accumulated depreciation of $25 in 2025 and 2024
12,000,000 US dollars
Construction work in progress
1,000,000 US dollars
Accounts payable
1,450,000,000 US dollars
Term loan
700,000,000 US dollars
System benefit charge
438,000,000 US dollars
Customer deposits
395,000,000 US dollars
Other current liabilities
375,000,000 US dollars
Notes payable
350,000,000 US dollars
Accrued interest
336,000,000 US dollars
Regulatory liabilities
213,000,000 US dollars
Fair value of derivative liabilities
184,000,000 US dollars
Accrued wages
137,000,000 US dollars
Operating lease liabilities
119,000,000 US dollars
Accrued taxes
83,000,000 US dollars
Liabilities held for sale
0 US dollars
LONG-TERM DEBT
24,653,000,000 US dollars
Deferred income taxes and unamortized investment tax credits
9,164,000,000 US dollars
Regulatory liabilities
4,997,000,000 US dollars
Superfund and other environmental costs
1,032,000,000 US dollars
Pensions and retiree benefits
560,000,000 US dollars
Other deferred credits and noncurrent liabilities
550,000,000 US dollars
Asset retirement obligations
458,000,000 US dollars
Operating lease liabilities
394,000,000 US dollars
Provision for injuries and damages
184,000,000 US dollars
Fair value of derivative liabilities
136,000,000 US dollars
Common shareholders’ equity
23,783,000,000 US dollars

Chart connections

  • Assets equal liabilities plus consolidated equity. Consolidated equity includes noncontrolling interests when reported.
  • Treasury shares and other negative equity contributions reduce equity.
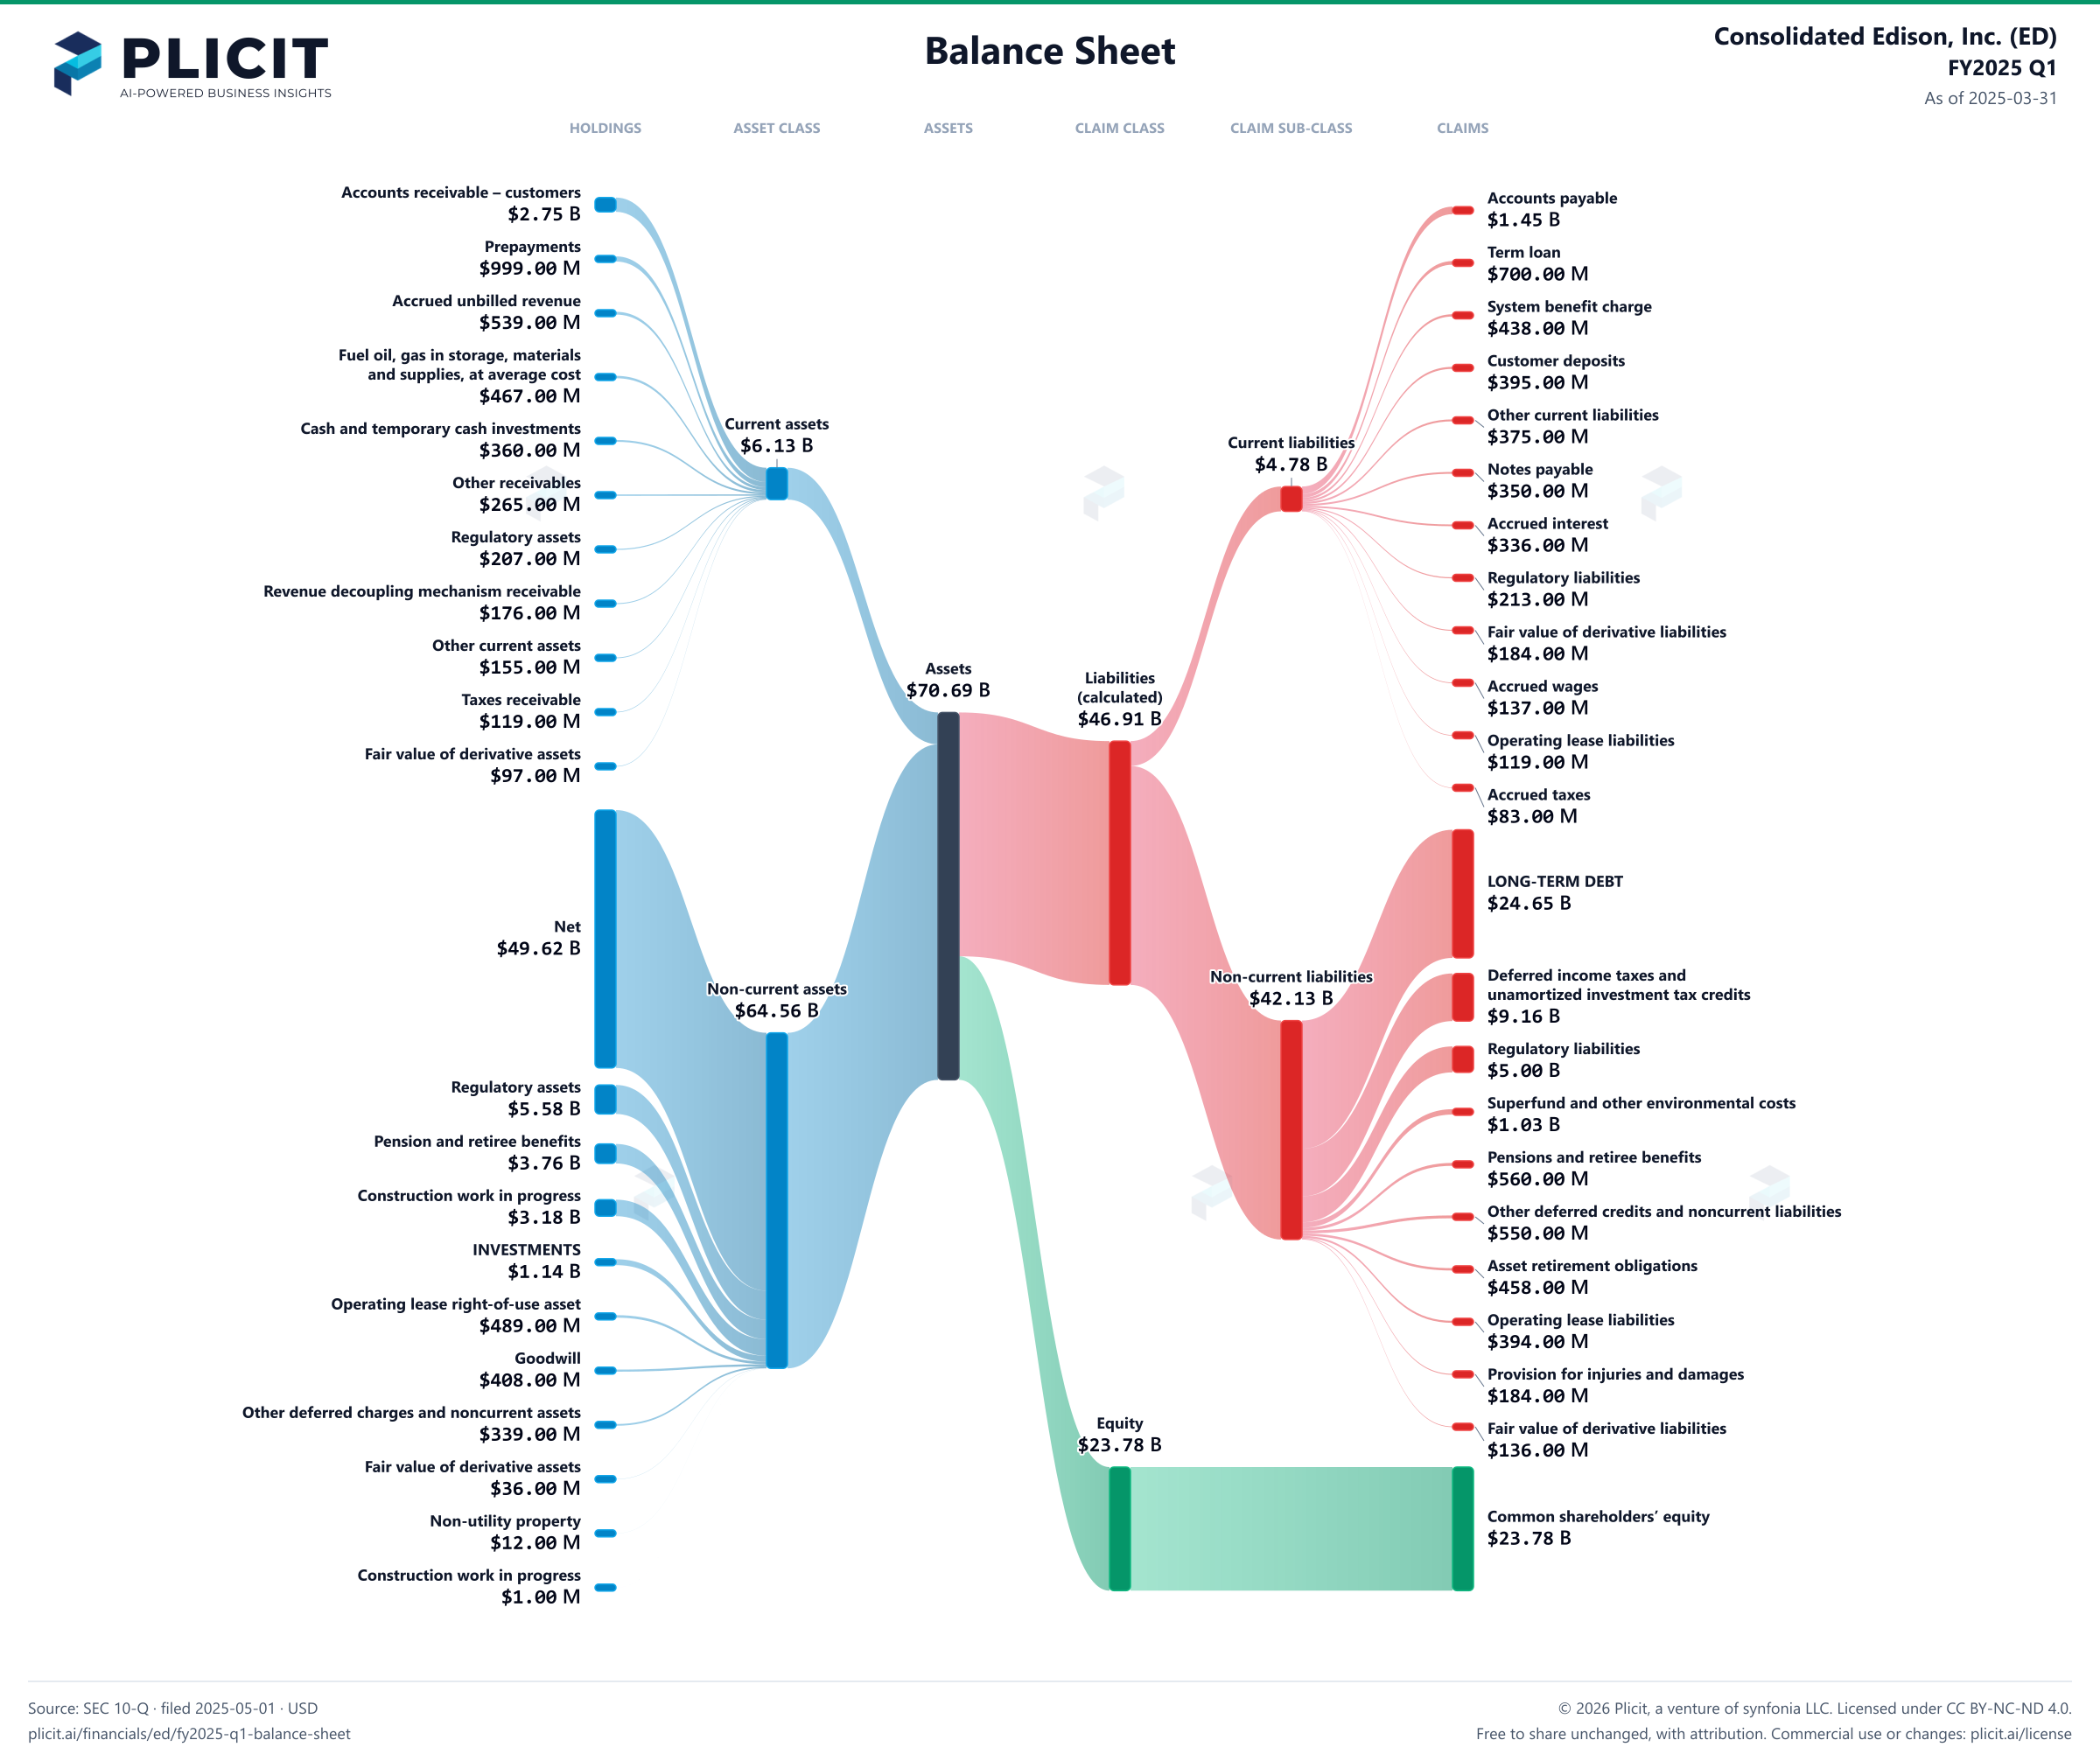
Consolidated Edison, Inc. (ED) FY2025 Q1 Balance Sheet Sankey chart
Free to share unchanged, with credit to Plicit.ai · CC BY-NC-ND 4.0Download PNG

Newsletter

Get the teardowns by email

Subscribe if you want the public-company teardowns in your inbox when they're released.

Product waitlist

Health Check and Teardown for your own company

A health check uncovers insights of your private books, not a public ticker. Join this list to get notified as soon as we go-live!