
EVEREST GROUP, LTD. (EG) FY2026 Q2 Balance Sheet
As of 2026-06-30
Balance Sheet
As of 2026-06-30
Swipe to see the full flow
Chart details
EVEREST GROUP, LTD. (EG) FY2026 Q2 Balance Sheet
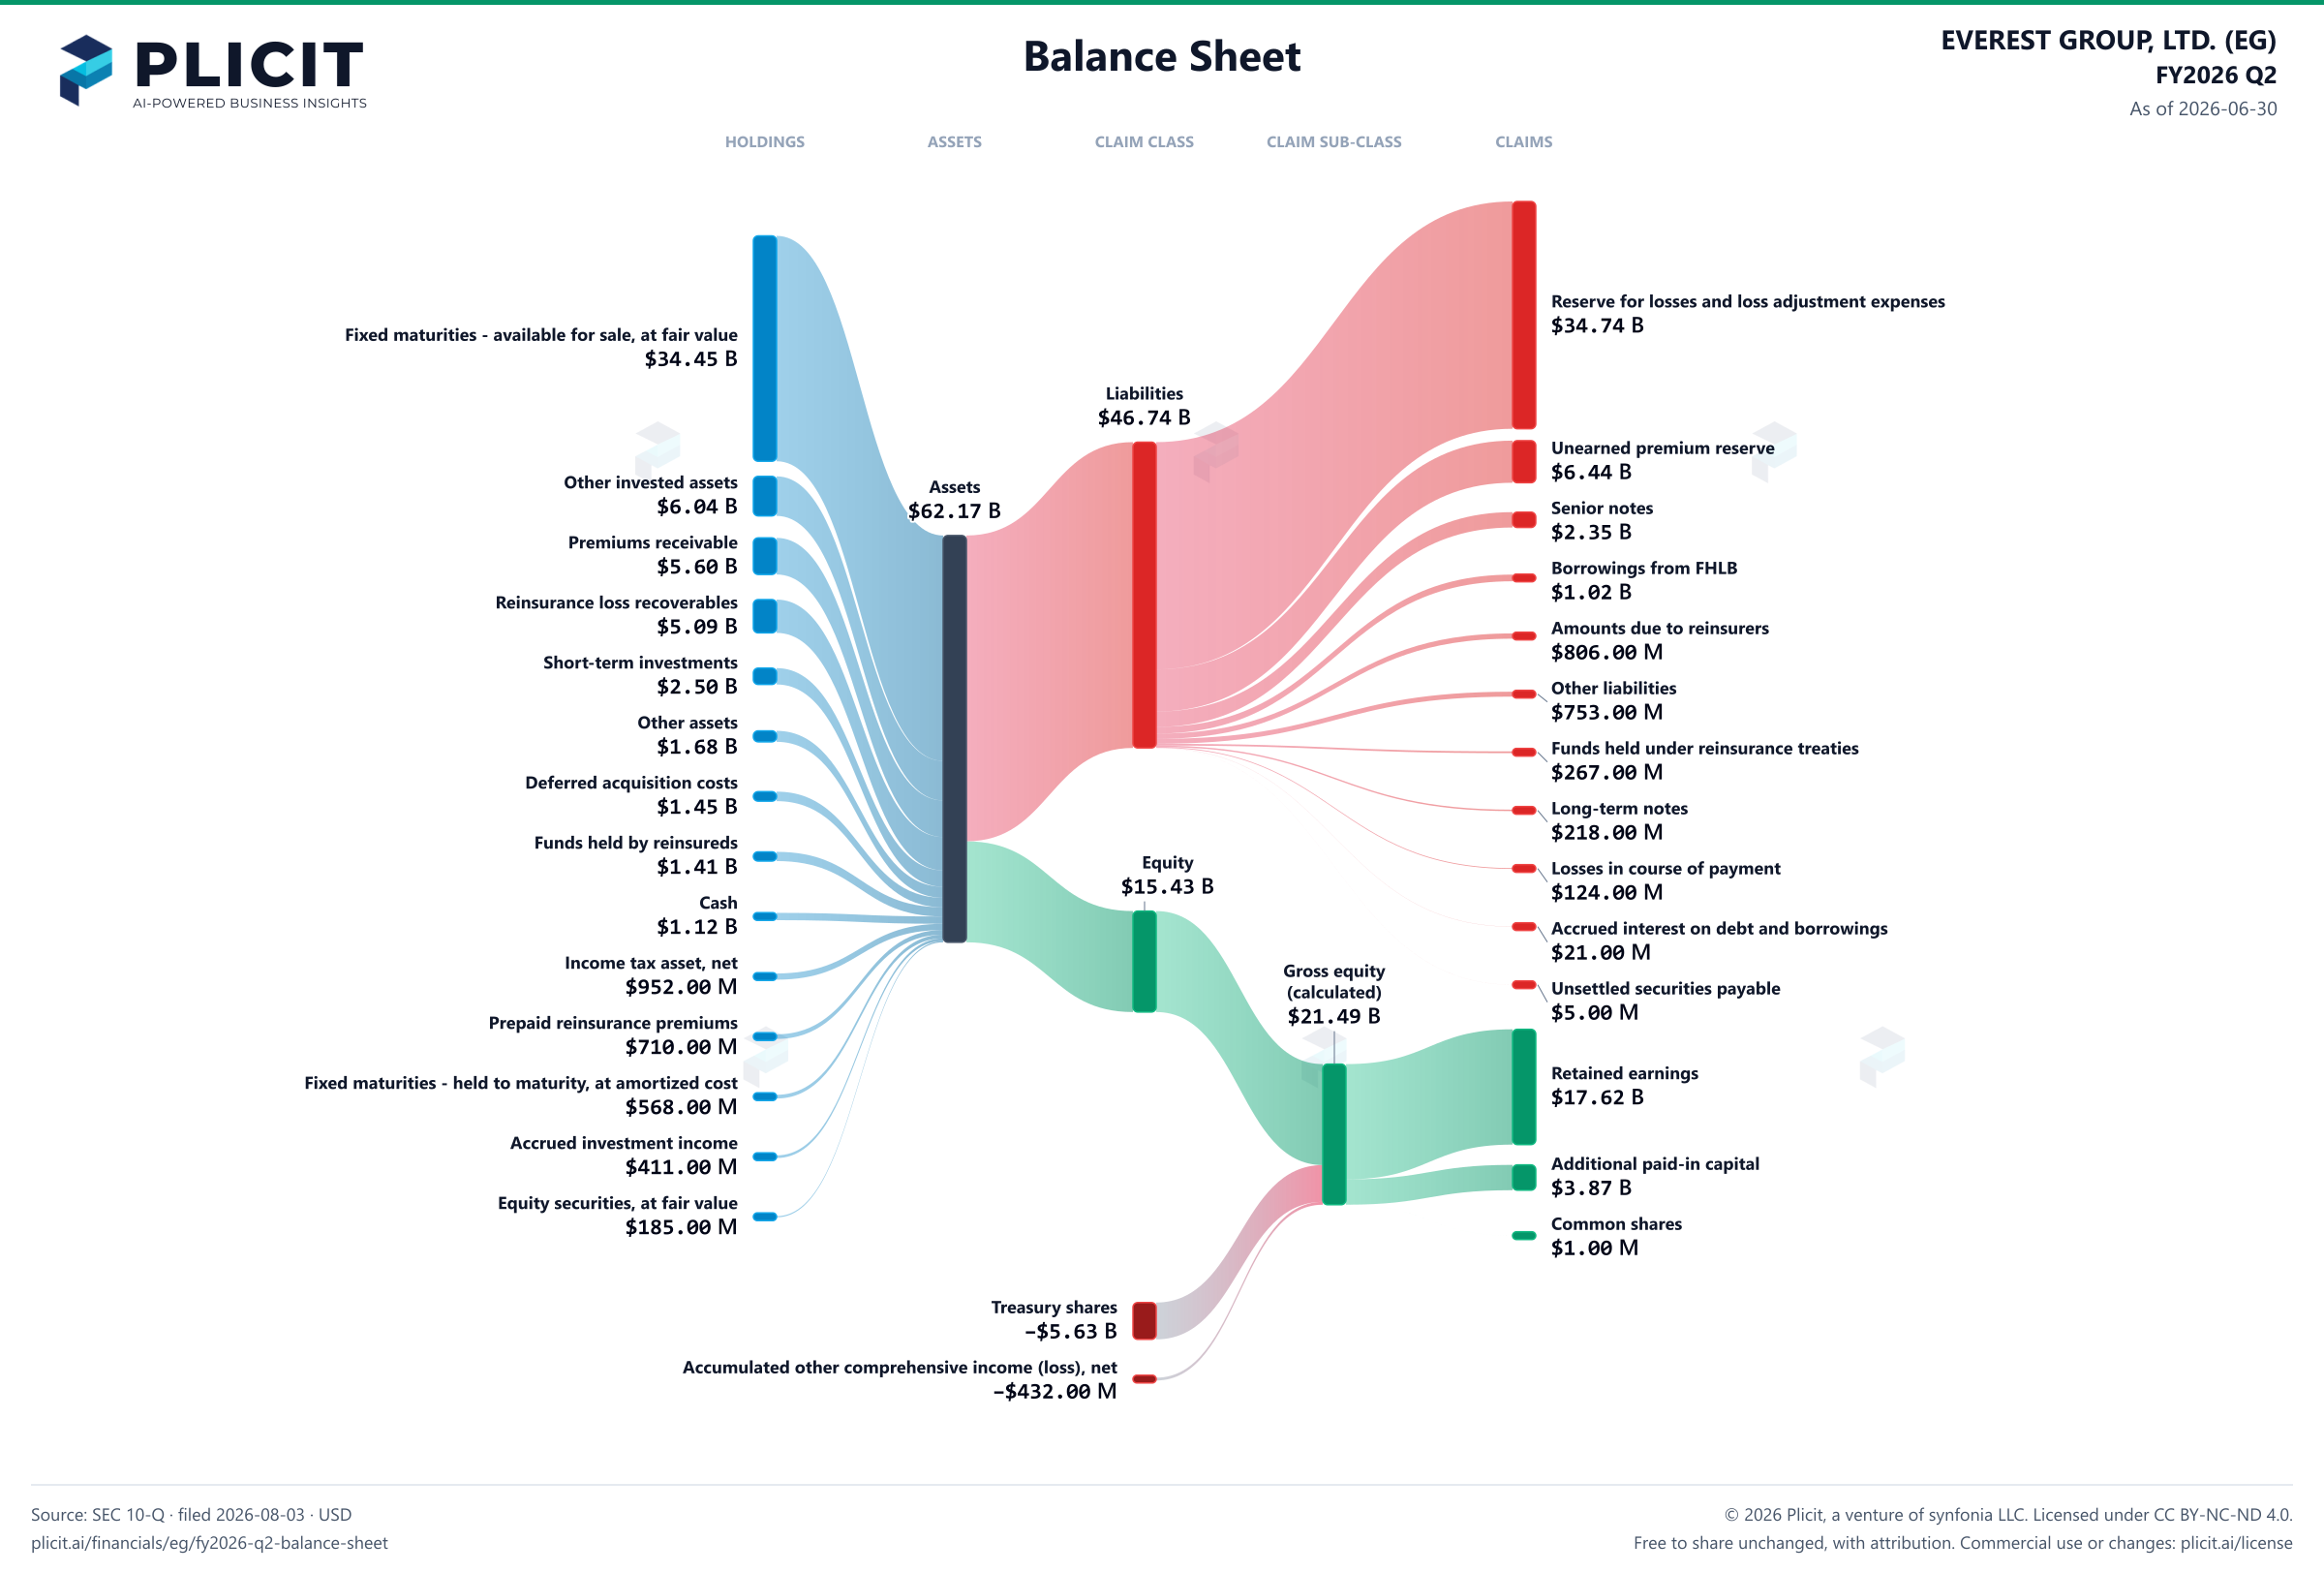
Balance sheet as of 2026-06-30. The chart shows assets, liabilities and equity at that date.
- Assets
- 62,167,000,000 US dollars
- Liabilities
- 46,737,000,000 US dollars
- Equity
- 15,430,000,000 US dollars
- Fixed maturities - available for sale, at fair value (amortized cost: 2026, $34,912; 2025, $34,620, credit allowances: 2026, $(64); 2025, $(68))
- 34,445,000,000 US dollars
- Other invested assets
- 6,044,000,000 US dollars
- Premiums receivable (net of credit allowances: 2026, $(99); 2025, $(94))
- 5,595,000,000 US dollars
- Reinsurance loss recoverables (net of credit allowances: 2026, $(61); 2025, $(57))
- 5,092,000,000 US dollars
- Short-term investments
- 2,503,000,000 US dollars
- Other assets (net of credit allowances: 2026, $(17); 2025, $(17))
- 1,682,000,000 US dollars
- Deferred acquisition costs
- 1,454,000,000 US dollars
- Funds held by reinsureds
- 1,408,000,000 US dollars
- Cash
- 1,117,000,000 US dollars
- Income tax asset, net
- 952,000,000 US dollars
- Prepaid reinsurance premiums
- 710,000,000 US dollars
- Fixed maturities - held to maturity, at amortized cost (fair value: 2026, $568; 2025, $576, net of credit allowances: 2026, $(8); 2025, $(6))
- 568,000,000 US dollars
- Accrued investment income
- 411,000,000 US dollars
- Equity securities, at fair value
- 185,000,000 US dollars
- Reserve for losses and loss adjustment expenses
- 34,735,000,000 US dollars
- Unearned premium reserve
- 6,436,000,000 US dollars
- Senior notes
- 2,352,000,000 US dollars
- Borrowings from FHLB
- 1,019,000,000 US dollars
- Amounts due to reinsurers
- 806,000,000 US dollars
- Other liabilities
- 753,000,000 US dollars
- Funds held under reinsurance treaties
- 267,000,000 US dollars
- Long-term notes
- 218,000,000 US dollars
- Losses in course of payment
- 124,000,000 US dollars
- Accrued interest on debt and borrowings
- 21,000,000 US dollars
- Unsettled securities payable
- 5,000,000 US dollars
- Retained earnings
- 17,620,000,000 US dollars
- Additional paid-in capital
- 3,871,000,000 US dollars
- Common shares, par value: $0.01; 200.0 shares authorized; 74.5 (2026) and 74.4 (2025) shares issued and outstanding
- 1,000,000 US dollars
- Preferred shares, par value: $0.01; 50.0 shares authorized; no shares issued and outstanding
- 0 US dollars
- Treasury shares, at cost; 35.8 shares (2026) and 33.7 shares (2025)
- negative 5,630,000,000 US dollars
- Accumulated other comprehensive income (loss), net of deferred income tax expense (benefit) of $(124) at 2026 and $(23) at 2025
- negative 432,000,000 US dollars
- Gross equity (calculated)
- 21,492,000,000 US dollars. Net equity plus the magnitudes of its negative contributions equals gross positive equity. The negative contributions enter this reconciliation as add-backs; their filed signs stay negative.
Chart connections
- Assets equal liabilities plus consolidated equity. Consolidated equity includes noncontrolling interests when reported.
- Treasury shares and other negative equity contributions reduce equity.
- The filed current assets and non-current assets lines add up to $62,166.00 M and the current assets and non-current assets total is $62,167.00 M; the $1.00 M difference is within the rounding of the filed amounts.
- The filed current liabilities and non-current liabilities lines add up to $46,736.00 M and the current liabilities and non-current liabilities total is $46,737.00 M; the $1.00 M difference is within the rounding of the filed amounts.
Free to share unchanged, with credit to Plicit.ai · CC BY-NC-ND 4.0Download PNG
Product waitlist
Health Check and Teardown for your own company
A health check uncovers insights of your private books, not a public ticker. Join this list to get notified as soon as we go-live!