
EMCOR Group, Inc. (EME) FY2025 Annual P&L / Income Statement

Revenue by Business Segment by Geography

2025-01-01 to 2025-12-31

Swipe to see the full flow
EMCOR Group, Inc. (EME) FY2025 Annual P&L / Income StatementIncome statement for 2025-01-01 through 2025-12-31. View: Segments by Geographical. Revenue uses this breakdown; costs and expenses retain the consolidated categories.SOURCESREVENUEGROSSOPERATINGPRE-TAXNETUnited States Mechanical Construction And Facilities Services - UNITED STATESUnited States Electrical Construction And Facilities Services - UNITED STATESUnited States Building Services - UNITED STATESUnited States Industrial Services - UNITED STATESUnited Kingdom Building Services - UNITED KINGDOMRevenuesGross profitCost of salesOperating incomeOperating costs, net of other operating income (calculated)Selling, general and administrative expensesGain on sale of United Kingdom operationsOther income (expense), net (calculated)Income before income taxesNet income including noncontrolling interestsIncome tax provisionOther income (expense), net (calculated)Other income,net (calculated)$8.21 MIncome before income taxesPretax income$1.72 BRevenuesRevenues$16.99 BGross profitGross profit$3.28 BOperating incomeOperating income$1.71 BNet income including noncontrolling interestsNet income includingnoncontrollinginterests$1.27 BUnited States Mechanical Construction And Facilities Services - UNITED STATESUnited States MechanicalConstruction And FacilitiesServices - UNITED STATES$7.05 BOperating costs, net of other operating income (calculated)Operating costs,net (calculated)$1.57 BIncome tax provisionIncome taxes$448.81 MCost of salesCost of sales$13.70 BSelling, general and administrative expensesSelling, general andadministrative expenses$1.71 BUnited States Electrical Construction And Facilities Services - UNITED STATESUnited States ElectricalConstruction And FacilitiesServices - UNITED STATES$5.07 BGain on sale of United Kingdom operationsGain on sale of UnitedKingdom operations−$144.88 MUnited States Building Services - UNITED STATESUnited States BuildingServices - UNITED STATES$3.12 BUnited States Industrial Services - UNITED STATESUnited States IndustrialServices - UNITED STATES$1.27 BUnited Kingdom Building Services - UNITED KINGDOMUnited Kingdom BuildingServices - UNITED KINGDOM$471.35 M
Chart details

EMCOR Group, Inc. (EME) FY2025 Annual P&L / Income Statement

Income statement for 2025-01-01 through 2025-12-31. View: Segments by Geographical. Revenue uses this breakdown; costs and expenses retain the consolidated categories.

Revenues
16,986,422,000 US dollars
Cost of sales
13,703,434,000 US dollars
Gross profit
3,282,988,000 US dollars
Operating costs, net of other operating income (calculated)
1,569,570,000 US dollars
Operating income
1,713,418,000 US dollars
Other income (expense), net (calculated)
8,206,000 US dollars
Income before income taxes
1,721,624,000 US dollars
Income tax provision
448,807,000 US dollars
Net income including noncontrolling interests
1,272,817,000 US dollars
United Kingdom Building Services - UNITED KINGDOM
471,348,000 US dollars
United States Building Services - UNITED STATES
3,122,242,000 US dollars
United States Electrical Construction And Facilities Services - UNITED STATES
5,074,252,000 US dollars
United States Industrial Services - UNITED STATES
1,268,099,000 US dollars
United States Mechanical Construction And Facilities Services - UNITED STATES
7,050,481,000 US dollars
Selling, general and administrative expenses
1,714,446,000 US dollars
Impairment loss on long-lived assets
0 US dollars
Gain on sale of United Kingdom operations
negative 144,876,000 US dollars

Chart connections

  • Revenue less cost of revenue equals gross profit; gross profit less operating expenses equals operating income.
  • Operating income plus other income or expense equals income before tax. Income before tax less income tax expense or benefit equals net income.
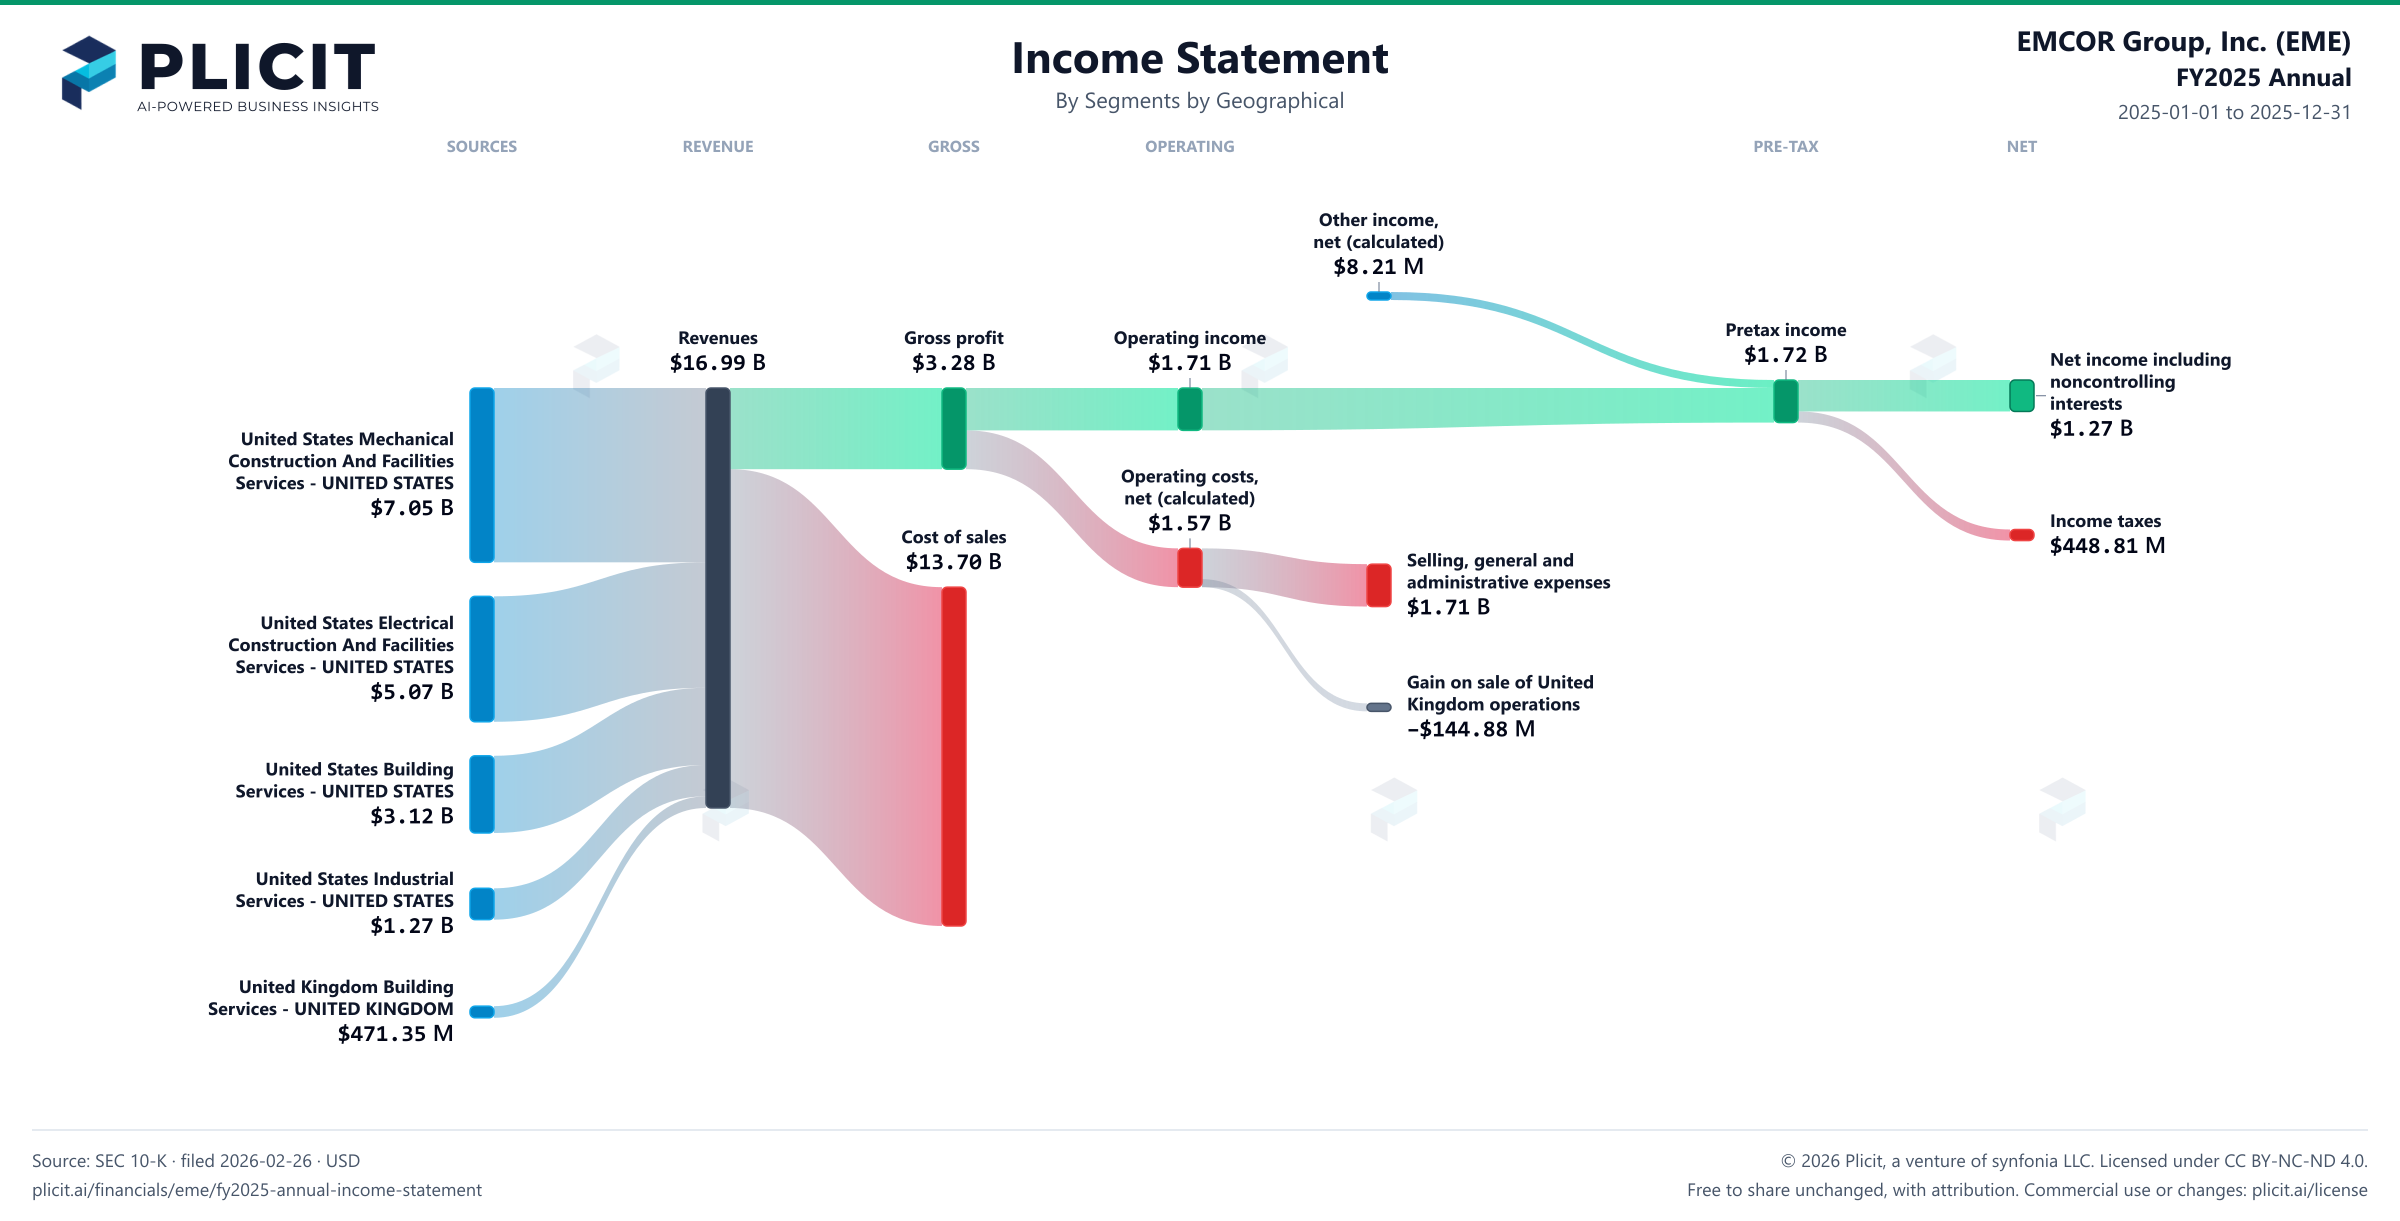
EMCOR Group, Inc. (EME) FY2025 Annual P&L / Income Statement Sankey chart
Free to share unchanged, with credit to Plicit.ai · CC BY-NC-ND 4.0Download PNG

Gross margin

19.3%

Gross profit / revenue

Operating margin

10.1%

Operating profit / revenue

Cash conversion

102.3%

Operating cash / net income, same period

Newsletter

Get the teardowns by email

Subscribe if you want the public-company teardowns in your inbox when they're released.

Product waitlist

Health Check and Teardown for your own company

A health check uncovers insights of your private books, not a public ticker. Join this list to get notified as soon as we go-live!