
ENBRIDGE INC. (ENB) FY2024 Annual Balance Sheet

Balance Sheet

As of 2024-12-31

Swipe to see the full flow
ENBRIDGE INC. (ENB) FY2024 Annual Balance SheetBalance sheet as of 2024-12-31. The chart shows assets, liabilities and equity at that date.Current liabilities$23.81 BCurrent assets$13.16 BLiabilities$150.08 BAssets$218.97 BNon-current liabilities$126.27 BNon-current assets$205.81 BEquity$68.89 BGross equity(calculated)$88.94 BHOLDINGSASSET CLASSASSETSCLAIM CLASSCLAIM SUB-CLASSCLAIMSTrade receivables and unbilled revenuesOther current assetsCash and cash equivalentsInventory (Note 10)Restricted cashAccounts receivable from affiliatesProperty, plant and equipment, net (Note 11)Goodwill (Note 15)Long-term investments (Note 13)Deferred amounts and other assetsIntangible assets, net (Note 14)Restricted long-term investments and cash (Note 23)Deferred income taxes (Note 24)Current portion of long-term debt (Note 17)Other current liabilities (Note 16)Trade payables and accrued liabilitiesInterest payableShort-term borrowings (Note 17)Accounts payable to affiliatesLong-term debt (Note 17)Deferred income taxes (Note 24)Other long-term liabilitiesCommon shares (2,178 and 2,125 outstanding at December 31, 2024 and 2023, respectively)Accumulated other comprehensive income (Note 22)Preference sharesAdditional paid-in capitalNoncontrolling interests (Note 19)Current assetsNon-current assetsAssetsCurrent liabilitiesNon-current liabilitiesLiabilitiesEquityGross equity (calculated)DeficitCurrent portion of long-term debt (Note 17)Current portion of long-term debt (Note 17)$7.73 BTrade receivables and unbilled revenuesTrade receivables and unbilled revenues$6.92 BOther current liabilities (Note 16)Other current liabilities (Note 16)$7.24 BCurrent liabilitiesCurrent liabilities$23.81 BOther current assetsOther current assets$2.77 BTrade payables and accrued liabilitiesTrade payables and accrued liabilities$7.06 BCurrent assetsCurrent assets$13.16 BCash and cash equivalentsCash and cash equivalents$1.80 BInterest payableInterest payable$1.23 BLiabilitiesLiabilities$150.08 BInventory (Note 10)Inventory (Note 10)$1.49 BShort-term borrowings (Note 17)Short-term borrowings (Note 17)$529.00 MAssetsAssets$218.97 BRestricted cashRestricted cash$92.00 MAccounts payable to affiliatesAccounts payable to affiliates$22.00 MNon-current liabilitiesNon-current liabilities$126.27 BAccounts receivable from affiliatesAccounts receivable from affiliates$90.00 MLong-term debt (Note 17)Long-term debt (Note 17)$93.41 BNon-current assetsNon-current assets$205.81 BProperty, plant and equipment, net (Note 11)Property, plant and equipment, net (Note 11)$131.10 BDeferred income taxes (Note 24)Deferred income taxes (Note 24)$19.60 BOther long-term liabilitiesOther long-term liabilities$13.26 BEquityEquity$68.89 BGoodwill (Note 15)Goodwill (Note 15)$36.60 BGross equity (calculated)Gross equity(calculated)$88.94 BCommon shares (2,178 and 2,125 outstanding at December 31, 2024 and 2023, respectively)Common shares$71.74 BLong-term investments (Note 13)Long-term investments (Note 13)$20.69 BDeferred amounts and other assetsDeferred amounts and other assets$11.03 BAccumulated other comprehensive income (Note 22)Accumulated other comprehensive income (Note 22)$7.12 BIntangible assets, net (Note 14)Intangible assets, net (Note 14)$4.59 BPreference sharesPreference shares$6.82 BRestricted long-term investments and cash (Note 23)Restricted long-term investments and cash (Note 23)$998.00 MAdditional paid-in capitalAdditional paid-in capital$275.00 MDeferred income taxes (Note 24)Deferred income taxes (Note 24)$796.00 MNoncontrolling interests (Note 19)Noncontrolling interests (Note 19)$2.99 BDeficitDeficit−$20.05 B
Chart details

ENBRIDGE INC. (ENB) FY2024 Annual Balance Sheet

Balance sheet as of 2024-12-31. The chart shows assets, liabilities and equity at that date.

Assets
218,973,000,000 US dollars
Current assets
13,163,000,000 US dollars
Non-current assets
205,810,000,000 US dollars
Liabilities
150,080,000,000 US dollars
Current liabilities
23,812,000,000 US dollars
Non-current liabilities
126,268,000,000 US dollars
Equity
68,893,000,000 US dollars
Noncontrolling interest
2,993,000,000 US dollars. Included in consolidated equity; this amount is not added again.
Trade receivables and unbilled revenues
6,920,000,000 US dollars
Other current assets
2,770,000,000 US dollars
Cash and cash equivalents
1,803,000,000 US dollars
Inventory (Note 10)
1,488,000,000 US dollars
Restricted cash
92,000,000 US dollars
Accounts receivable from affiliates
90,000,000 US dollars
Property, plant and equipment, net (Note 11)
131,104,000,000 US dollars
Goodwill (Note 15)
36,600,000,000 US dollars
Long-term investments (Note 13)
20,691,000,000 US dollars
Deferred amounts and other assets
11,034,000,000 US dollars
Intangible assets, net (Note 14)
4,587,000,000 US dollars
Restricted long-term investments and cash (Note 23)
998,000,000 US dollars
Deferred income taxes (Note 24)
796,000,000 US dollars
Current portion of long-term debt (Note 17)
7,729,000,000 US dollars
Other current liabilities (Note 16)
7,241,000,000 US dollars
Trade payables and accrued liabilities
7,060,000,000 US dollars
Interest payable
1,231,000,000 US dollars
Short-term borrowings (Note 17)
529,000,000 US dollars
Accounts payable to affiliates
22,000,000 US dollars
Long-term debt (Note 17)
93,414,000,000 US dollars
Deferred income taxes (Note 24)
19,596,000,000 US dollars
Other long-term liabilities
13,258,000,000 US dollars
Common shares (2,178 and 2,125 outstanding at December 31, 2024 and 2023, respectively)
71,738,000,000 US dollars
Accumulated other comprehensive income (Note 22)
7,115,000,000 US dollars
Preference shares
6,818,000,000 US dollars
Additional paid-in capital
275,000,000 US dollars
Noncontrolling interests (Note 19)
2,993,000,000 US dollars
Deficit
negative 20,046,000,000 US dollars
Gross equity (calculated)
88,939,000,000 US dollars. Net equity plus the magnitudes of its negative contributions equals gross positive equity. The negative contributions enter this reconciliation as add-backs; their filed signs stay negative.

Chart connections

  • Assets equal liabilities plus consolidated equity. Consolidated equity includes noncontrolling interests when reported.
  • Treasury shares and other negative equity contributions reduce equity.
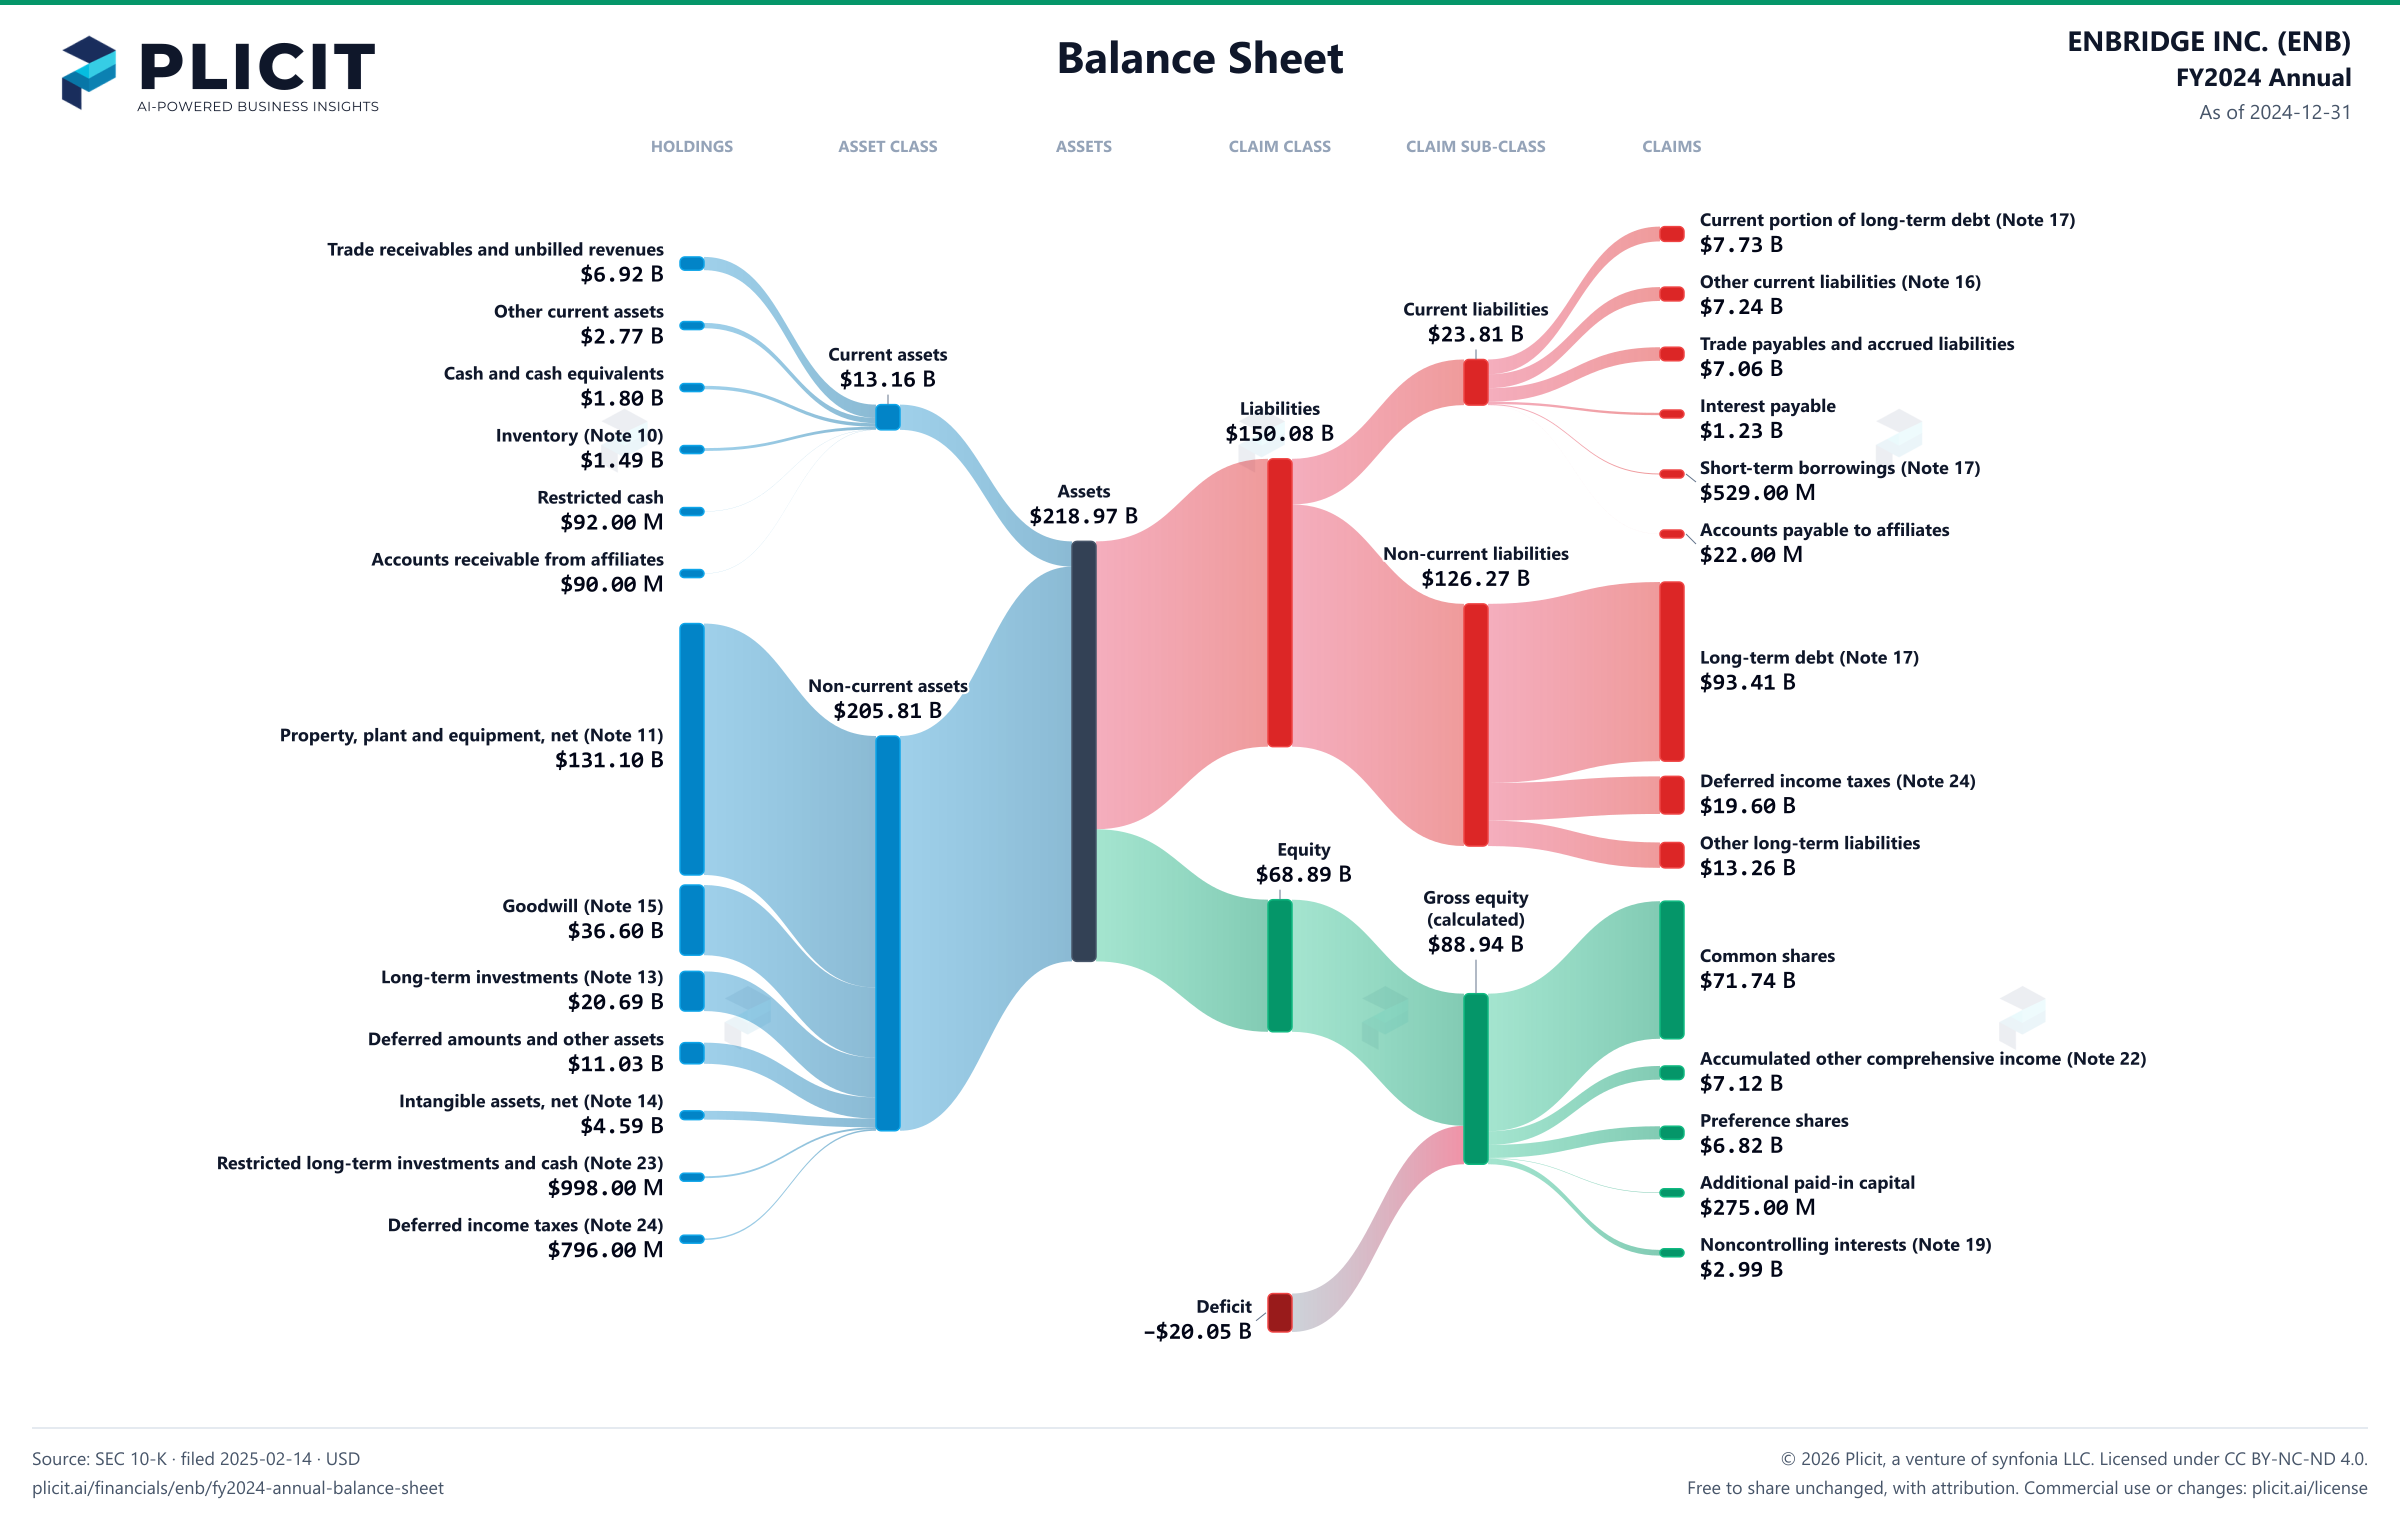
ENBRIDGE INC. (ENB) FY2024 Annual Balance Sheet Sankey chart
Free to share unchanged, with credit to Plicit.ai · CC BY-NC-ND 4.0Download PNG

Newsletter

Get the teardowns by email

Subscribe if you want the public-company teardowns in your inbox when they're released.

Product waitlist

Health Check and Teardown for your own company

A health check uncovers insights of your private books, not a public ticker. Join this list to get notified as soon as we go-live!