
ENTERPRISE PRODUCTS PARTNERS L.P. (EPD) FY2024 Q1 Balance Sheet
As of 2024-03-31
Balance Sheet
As of 2024-03-31
Swipe to see the full flow
Chart details
ENTERPRISE PRODUCTS PARTNERS L.P. (EPD) FY2024 Q1 Balance Sheet
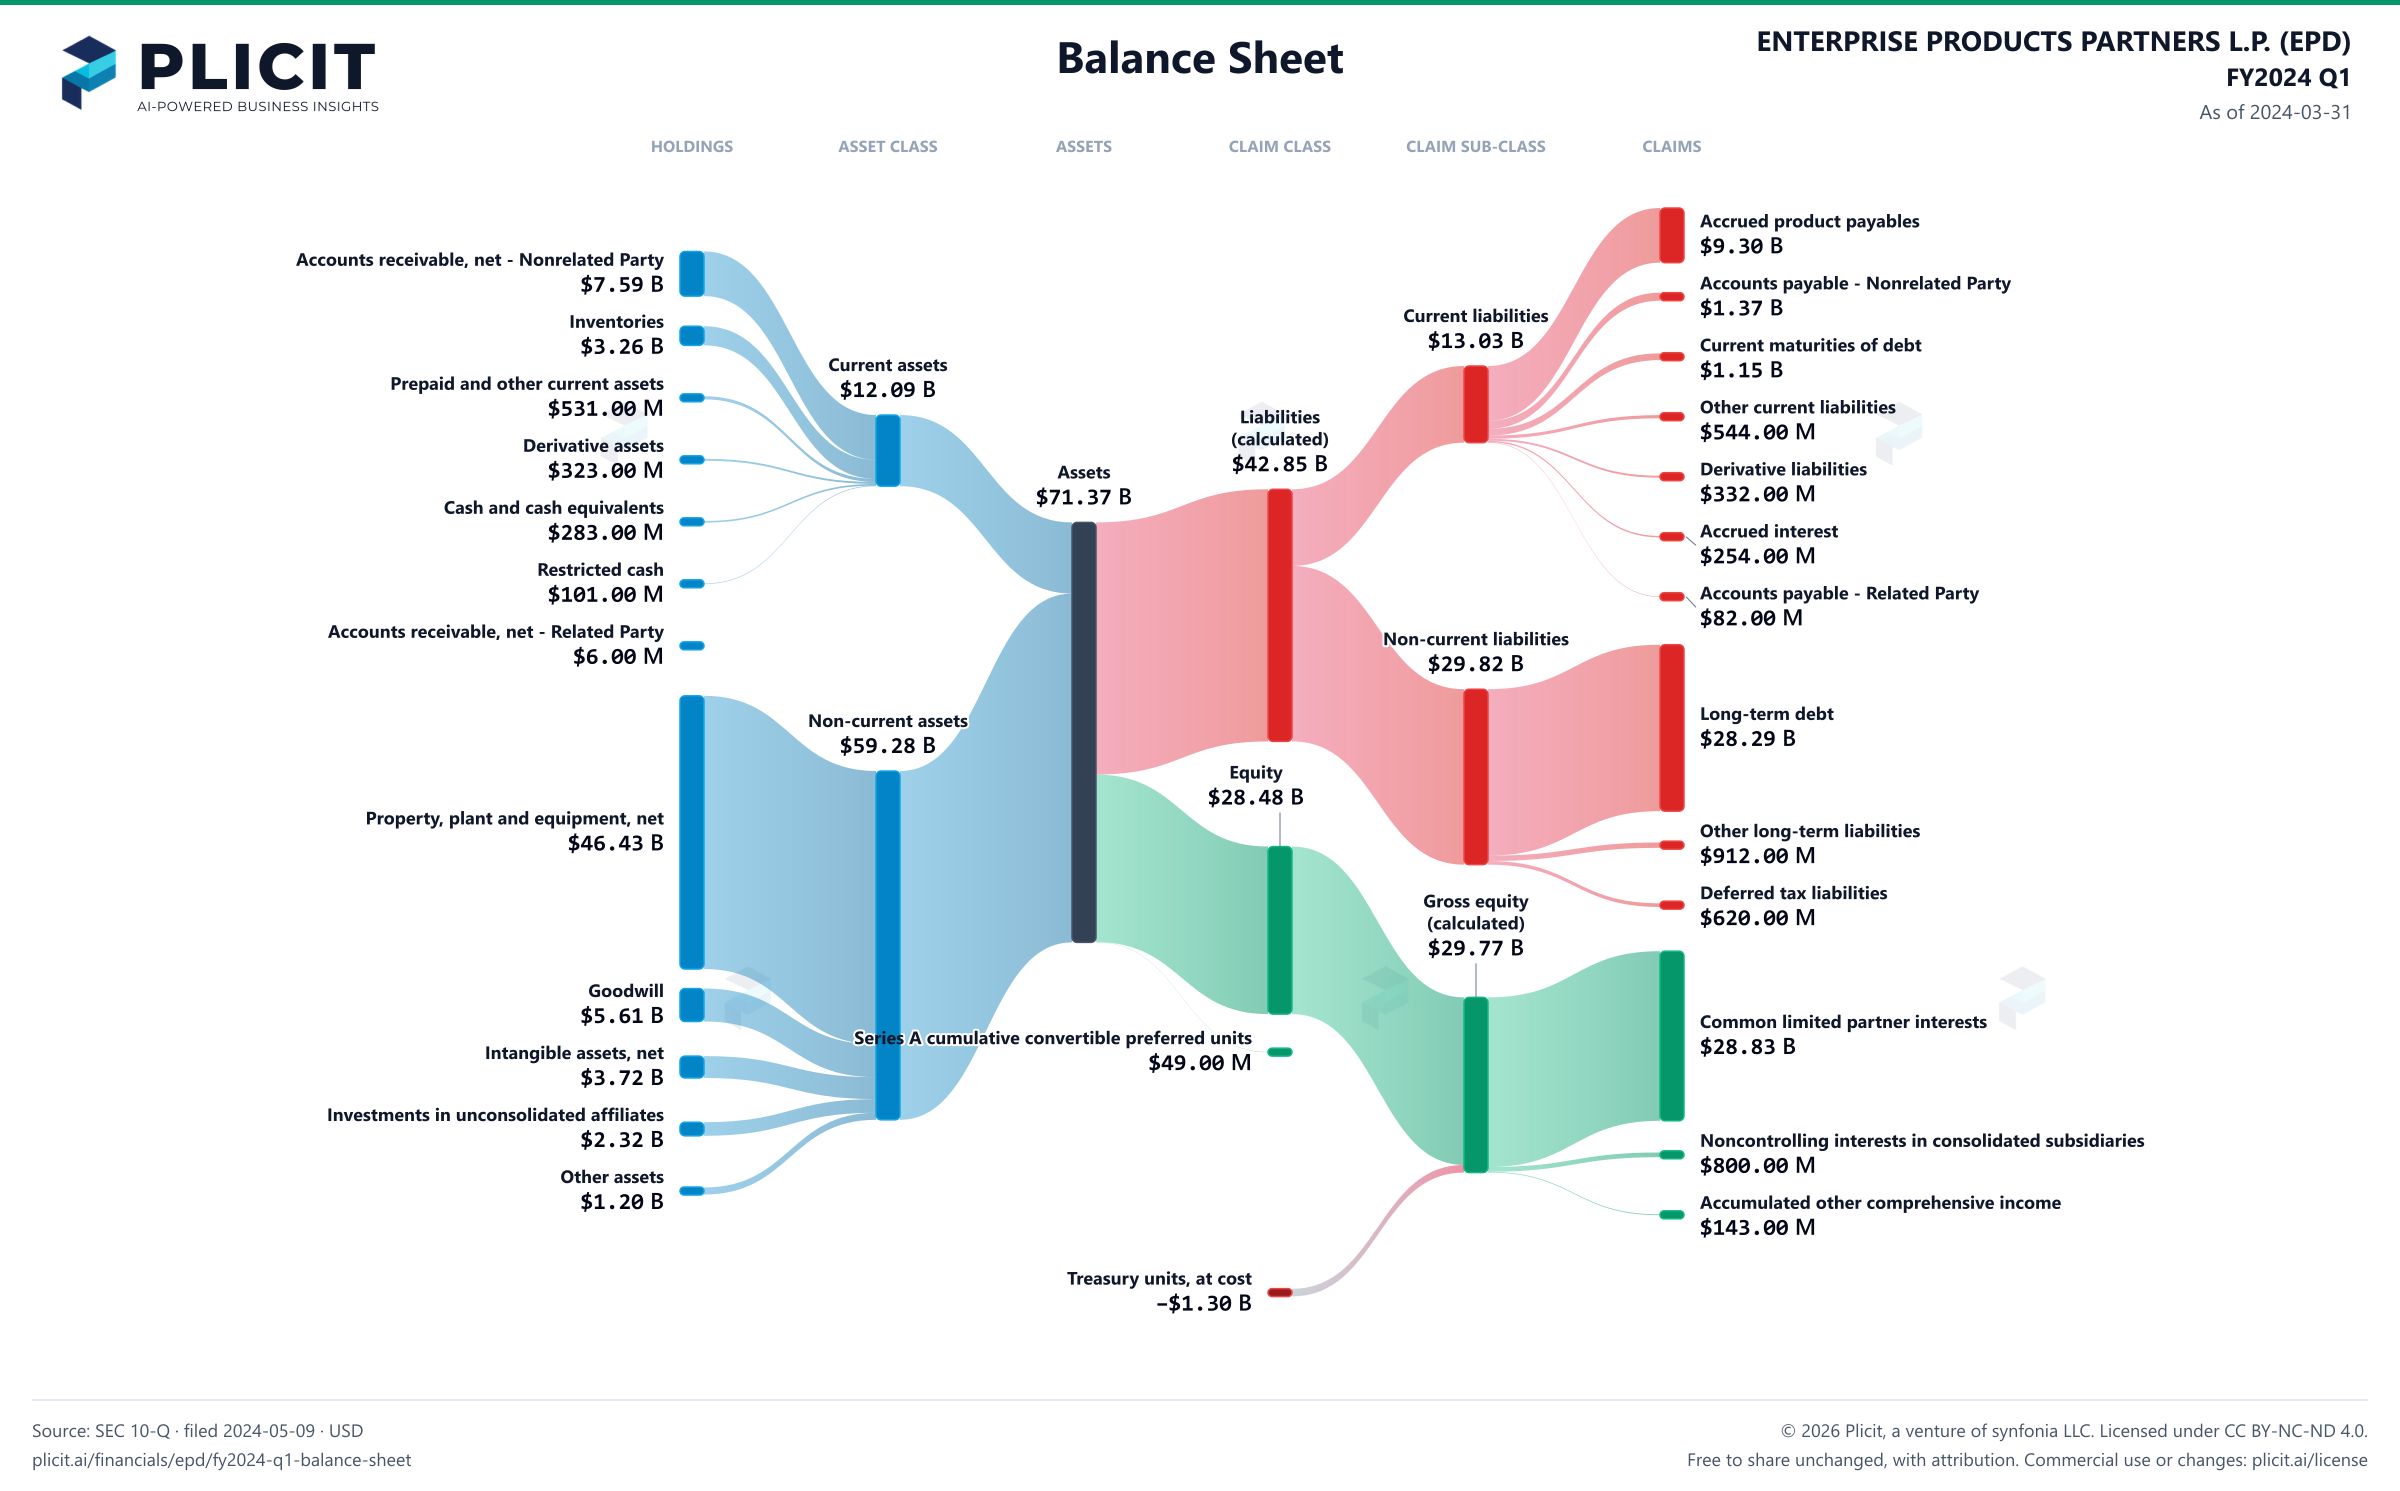
Balance sheet as of 2024-03-31. The chart shows assets, liabilities and equity at that date.
- Assets
- 71,373,000,000 US dollars
- Current assets
- 12,093,000,000 US dollars
- Non-current assets
- 59,280,000,000 US dollars
- Liabilities (calculated)
- 42,847,000,000 US dollars
- Current liabilities
- 13,030,000,000 US dollars
- Non-current liabilities
- 29,817,000,000 US dollars
- Equity
- 28,477,000,000 US dollars
- Series A cumulative convertible preferred units (50,412 units outstanding at March 31, 2024 and December 31, 2023)
- 49,000,000 US dollars
- Accounts receivable, net - Nonrelated Party
- 7,592,000,000 US dollars
- Inventories
- 3,257,000,000 US dollars
- Prepaid and other current assets
- 531,000,000 US dollars
- Derivative assets
- 323,000,000 US dollars
- Cash and cash equivalents
- 283,000,000 US dollars
- Restricted cash
- 101,000,000 US dollars
- Accounts receivable, net - Related Party
- 6,000,000 US dollars
- Property, plant and equipment, net
- 46,431,000,000 US dollars
- Goodwill
- 5,608,000,000 US dollars
- Intangible assets, net
- 3,720,000,000 US dollars
- Investments in unconsolidated affiliates
- 2,321,000,000 US dollars
- Other assets
- 1,200,000,000 US dollars
- Accrued product payables
- 9,297,000,000 US dollars
- Accounts payable - Nonrelated Party
- 1,372,000,000 US dollars
- Current maturities of debt
- 1,149,000,000 US dollars
- Other current liabilities
- 544,000,000 US dollars
- Derivative liabilities
- 332,000,000 US dollars
- Accrued interest
- 254,000,000 US dollars
- Accounts payable - Related Party
- 82,000,000 US dollars
- Long-term debt
- 28,285,000,000 US dollars
- Other long-term liabilities
- 912,000,000 US dollars
- Deferred tax liabilities
- 620,000,000 US dollars
- Common limited partner interests (2,171,558,354 units issued and outstanding at March 31, 2024 and 2,168,245,238 units issued and outstanding at December 31, 2023)
- 28,831,000,000 US dollars
- Noncontrolling interests in consolidated subsidiaries
- 800,000,000 US dollars
- Accumulated other comprehensive income
- 143,000,000 US dollars
- Treasury units, at cost
- negative 1,297,000,000 US dollars
- Gross equity (calculated)
- 29,774,000,000 US dollars. Net equity plus the magnitudes of its negative contributions equals gross positive equity. The negative contributions enter this reconciliation as add-backs; their filed signs stay negative.
Chart connections
- Assets equal liabilities plus temporary equity plus consolidated equity. Consolidated equity includes noncontrolling interests when reported.
- Treasury shares and other negative equity contributions reduce equity.
Free to share unchanged, with credit to Plicit.ai · CC BY-NC-ND 4.0Download PNG
Product waitlist
Health Check and Teardown for your own company
A health check uncovers insights of your private books, not a public ticker. Join this list to get notified as soon as we go-live!