
EPR PROPERTIES (EPR) FY2026 Q2 Balance Sheet

Balance Sheet

As of 2026-06-30

Swipe to see the full flow
EPR PROPERTIES (EPR) FY2026 Q2 Balance SheetBalance sheet as of 2026-06-30. The chart shows assets, liabilities and equity at that date.Liabilities$3.74 BAssets$6.05 BEquity$2.31 BGross equity(calculated)$4.00 BHOLDINGSASSETSCLAIM CLASSCLAIM SUB-CLASSCLAIMSReal Estate Investment Property, NetFinancing Receivable, after Allowance for Credit Loss, CurrentOperating Lease, Right-of-Use AssetAccounts receivable, netOther assetsLand held for developmentCash and cash equivalentsProperty under developmentInvestment in joint venturesRestricted cashDebtOperating Lease, LiabilityUnearned rents and interestAccounts payable and accrued liabilitiesDividends Payable, CurrentPreferred dividends payableAdditional paid-in-capitalCommon Stock, Value, IssuedPreferred shares - Series G Preferred StockPreferred shares - Series C Preferred SharesPreferred shares - Series E Preferred SharesAssetsLiabilitiesEquityGross equity (calculated)Distributions in excess of net incomeTreasury Stock, ValueAccumulated other comprehensive incomeLiabilitiesLiabilities$3.74 BDebtDebt$3.29 BReal Estate Investment Property, NetReal Estate Investment Property, Net$4.95 BOperating Lease, LiabilityOperating Lease, Liability$231.88 MAssetsAssets$6.05 BUnearned rents and interestUnearned rents and interest$109.28 MAccounts payable and accrued liabilitiesAccounts payable and accrued liabilities$78.75 MDividends Payable, CurrentDividends Payable, Current$23.73 MFinancing Receivable, after Allowance for Credit Loss, CurrentFinancing Receivable, afterAllowance for Credit Loss, Current$616.88 MPreferred dividends payablePreferred dividends payable$6.03 MEquityEquity$2.31 BOperating Lease, Right-of-Use AssetOperating Lease, Right-of-Use Asset$199.19 MGross equity (calculated)Gross equity(calculated)$4.00 BAccounts receivable, netAccounts receivable, net$111.42 MOther assetsOther assets$111.17 MAdditional paid-in-capitalAdditional paid-in-capital$4.00 BLand held for developmentLand held for development$20.17 MCash and cash equivalentsCash and cash equivalents$16.20 MProperty under developmentProperty under development$10.05 MCommon Stock, Value, IssuedCommon Stock, Value, Issued$849.00 KInvestment in joint venturesInvestment in joint ventures$8.69 MPreferred shares - Series G Preferred StockPreferred shares - Series G Preferred Stock$60.00 KRestricted cashRestricted cash$4.39 MPreferred shares - Series C Preferred SharesPreferred shares - Series C Preferred Shares$54.00 KPreferred shares - Series E Preferred SharesPreferred shares - Series E Preferred Shares$34.00 KDistributions in excess of net incomeDistributions in excess of net income−$1.38 BTreasury Stock, ValueTreasury Stock, Value−$308.56 MAccumulated other comprehensive incomeAccumulated other comprehensive income−$771.00 K
Chart details

EPR PROPERTIES (EPR) FY2026 Q2 Balance Sheet

Balance sheet as of 2026-06-30. The chart shows assets, liabilities and equity at that date.

Assets
6,052,113,000 US dollars
Liabilities
3,742,689,000 US dollars
Equity
2,309,424,000 US dollars
Real Estate Investment Property, Net
4,953,959,000 US dollars
Financing Receivable, after Allowance for Credit Loss, Current
616,881,000 US dollars
Operating Lease, Right-of-Use Asset
199,192,000 US dollars
Accounts receivable, net
111,421,000 US dollars
Other assets
111,168,000 US dollars
Land held for development
20,168,000 US dollars
Cash and cash equivalents
16,197,000 US dollars
Property under development
10,046,000 US dollars
Investment in joint ventures
8,693,000 US dollars
Restricted cash
4,388,000 US dollars
Debt
3,293,013,000 US dollars
Operating Lease, Liability
231,884,000 US dollars
Unearned rents and interest
109,280,000 US dollars
Accounts payable and accrued liabilities
78,750,000 US dollars
Dividends Payable, Current
23,730,000 US dollars
Preferred dividends payable
6,032,000 US dollars
Additional paid-in-capital
3,995,696,000 US dollars
Common Stock, Value, Issued
849,000 US dollars
Preferred shares - Series G Preferred Stock
60,000 US dollars
Preferred shares - Series C Preferred Shares
54,000 US dollars
Preferred shares - Series E Preferred Shares
34,000 US dollars
Distributions in excess of net income
negative 1,377,937,000 US dollars
Treasury Stock, Value
negative 308,561,000 US dollars
Accumulated other comprehensive income
negative 771,000 US dollars
Gross equity (calculated)
3,996,693,000 US dollars. Net equity plus the magnitudes of its negative contributions equals gross positive equity. The negative contributions enter this reconciliation as add-backs; their filed signs stay negative.

Chart connections

  • Assets equal liabilities plus consolidated equity. Consolidated equity includes noncontrolling interests when reported.
  • Treasury shares and other negative equity contributions reduce equity.
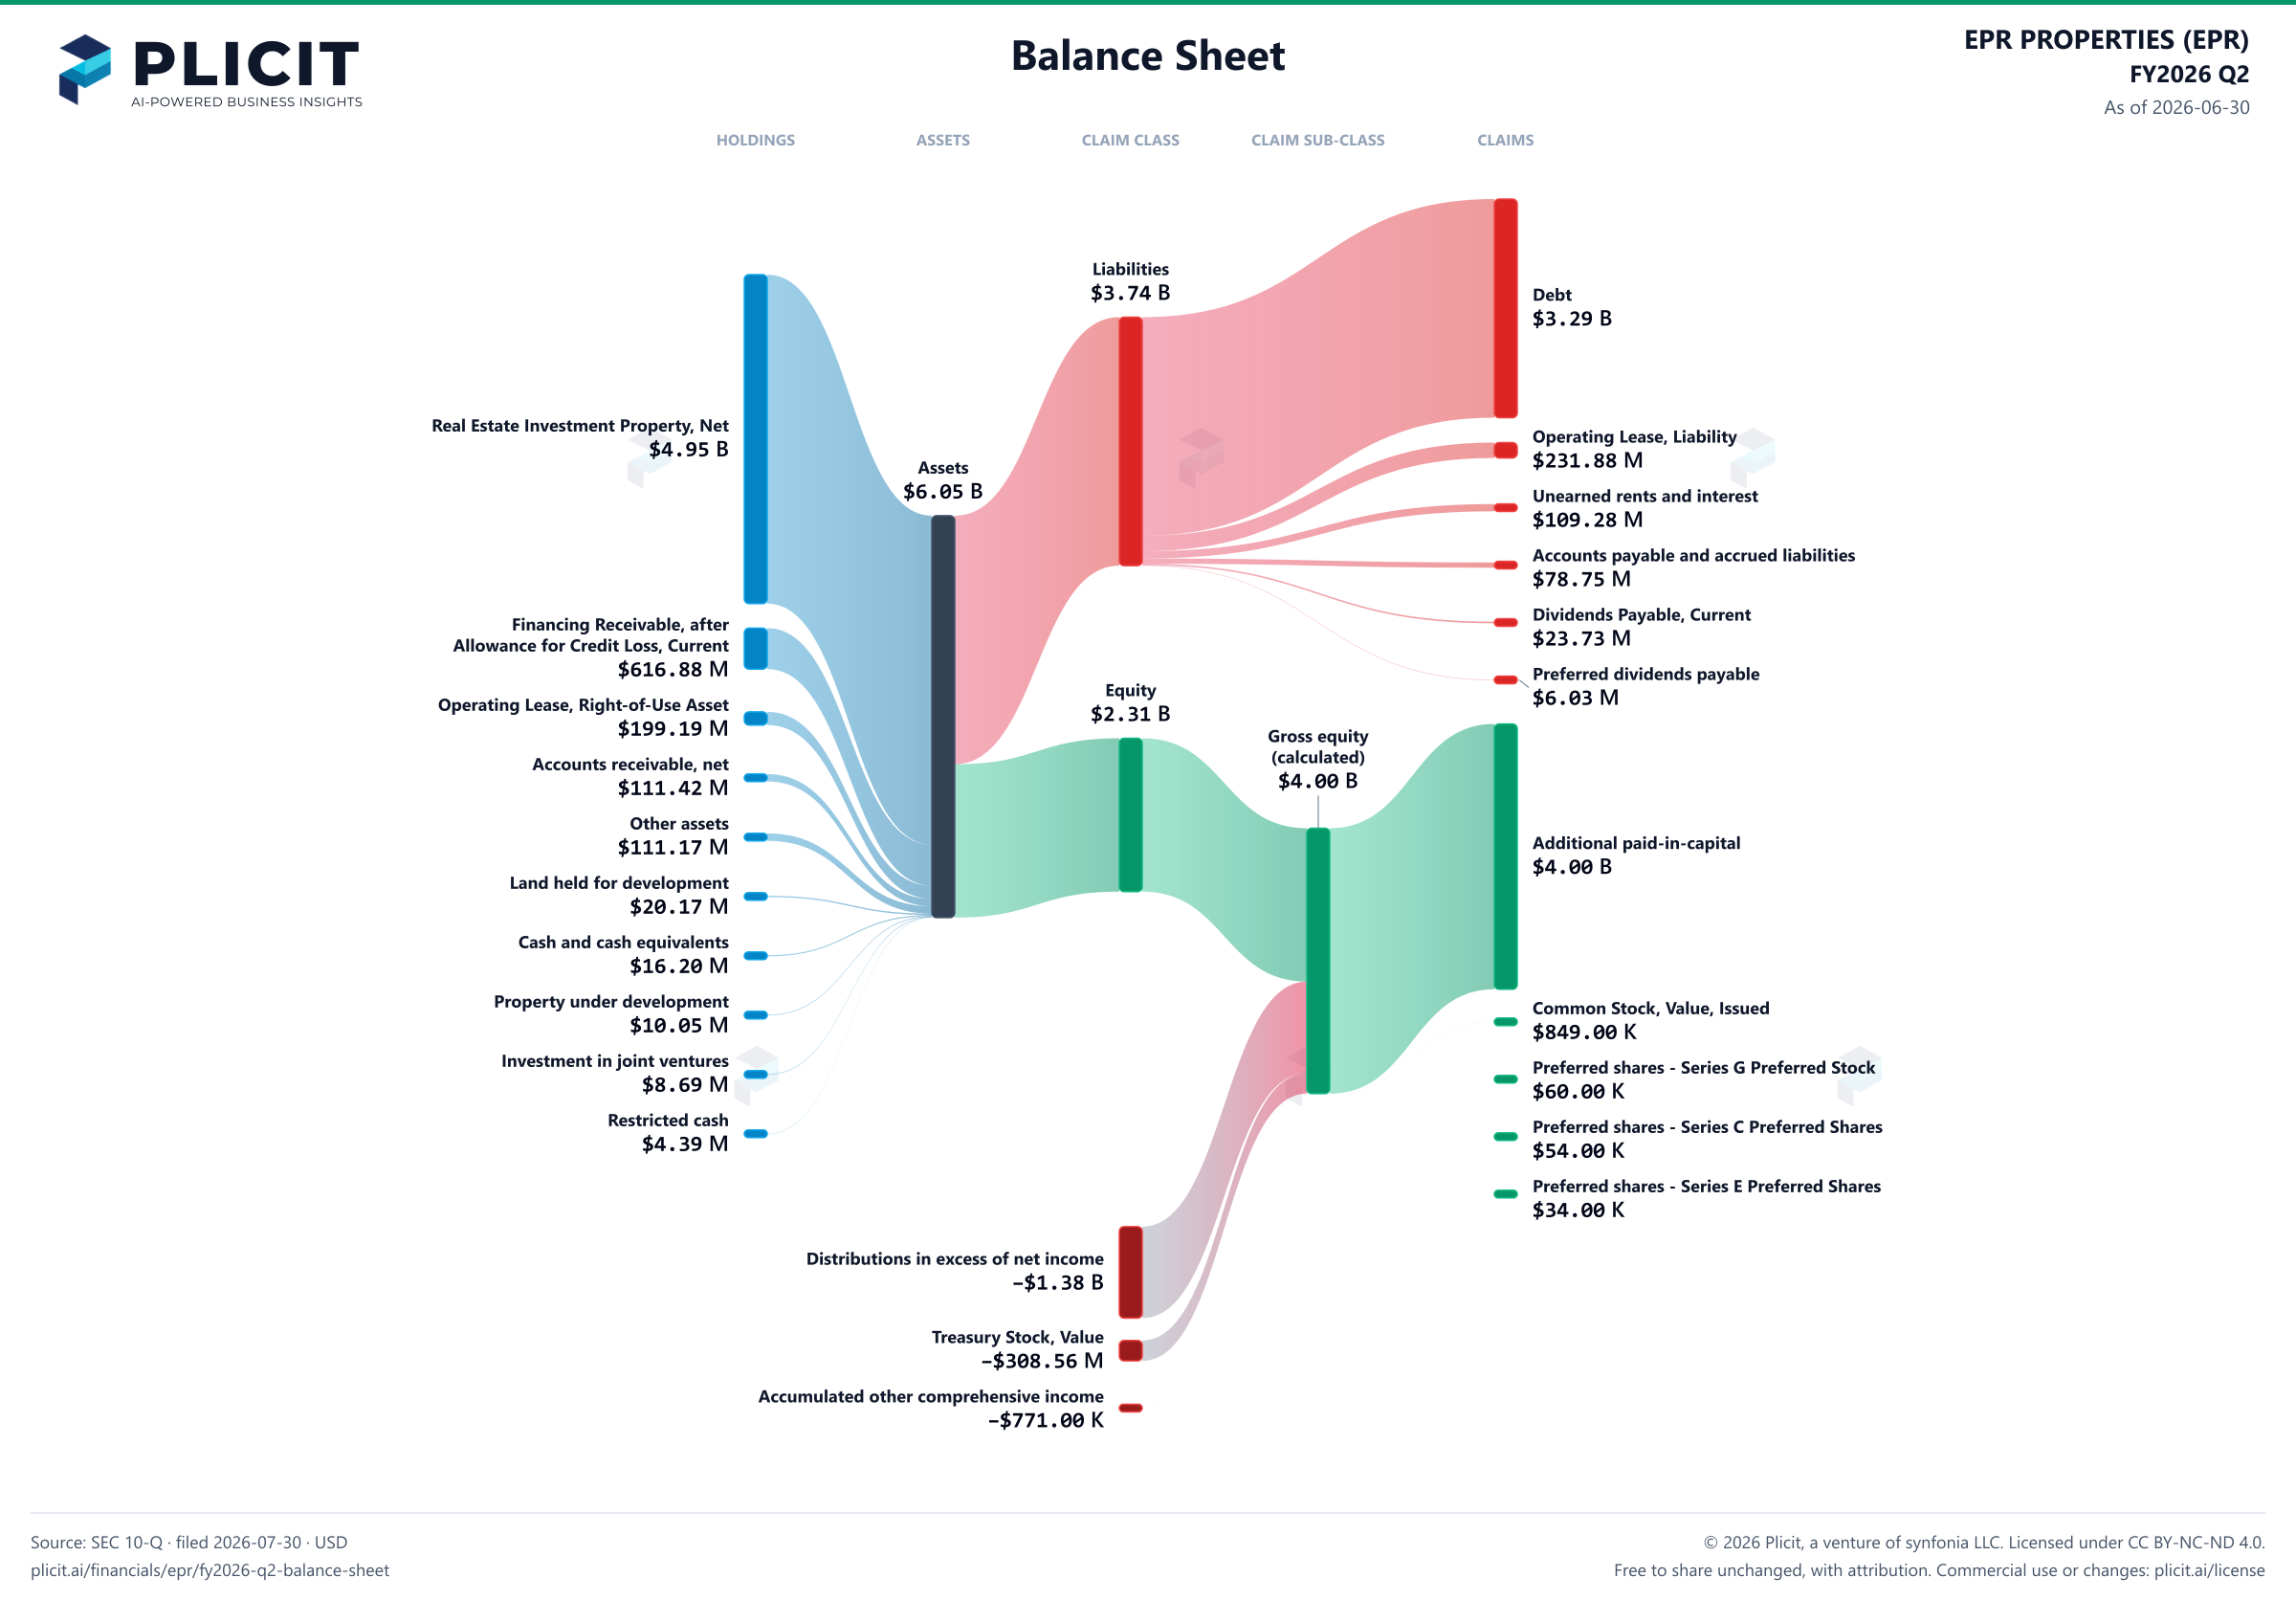
EPR PROPERTIES (EPR) FY2026 Q2 Balance Sheet Sankey chart
Free to share unchanged, with credit to Plicit.ai · CC BY-NC-ND 4.0Download PNG

Newsletter

Get the teardowns by email

Subscribe if you want the public-company teardowns in your inbox when they're released.

Product waitlist

Health Check and Teardown for your own company

A health check uncovers insights of your private books, not a public ticker. Join this list to get notified as soon as we go-live!