
EXPONENT, INC. (EXPO) FY2026 Q2 Balance Sheet
As of 2026-07-03
Balance Sheet
As of 2026-07-03
Swipe to see the full flow
Chart details
EXPONENT, INC. (EXPO) FY2026 Q2 Balance Sheet
Balance sheet as of 2026-07-03. The chart shows assets, liabilities and equity at that date.
- Assets
- 652,723,000 US dollars
- Current assets
- 312,014,000 US dollars
- Non-current assets
- 340,709,000 US dollars
- Liabilities
- 364,107,000 US dollars
- Current liabilities
- 157,838,000 US dollars
- Non-current liabilities
- 206,269,000 US dollars
- Equity
- 288,616,000 US dollars
- Accounts receivable, net of allowance for contract losses and doubtful accounts of $7,486 and $7,478 at July 3, 2026 and January 2, 2026, respectively
- 218,504,000 US dollars
- Cash and cash equivalents
- 66,629,000 US dollars
- Prepaid expenses and other current assets
- 26,881,000 US dollars
- Deferred compensation plan assets
- 122,823,000 US dollars
- Property, equipment and leasehold improvements, net of accumulated depreciation and amortization of $127,108 and $122,072 at July 3, 2026 and January 2, 2026, respectively
- 70,854,000 US dollars
- Operating lease right-of-use assets
- 68,954,000 US dollars
- Deferred income taxes
- 64,850,000 US dollars
- Goodwill
- 8,607,000 US dollars
- Other assets
- 4,621,000 US dollars
- Accrued payroll and employee benefits
- 102,186,000 US dollars
- Accounts payable and accrued liabilities
- 26,942,000 US dollars
- Deferred revenues
- 21,953,000 US dollars
- Operating lease liabilities
- 6,757,000 US dollars
- Deferred compensation plan liabilities
- 127,839,000 US dollars
- Operating lease liabilities
- 73,964,000 US dollars
- Other liabilities
- 4,466,000 US dollars
- Retained earnings
- 696,405,000 US dollars
- Additional paid-in capital
- 389,568,000 US dollars
- Common stock, $0.001 par value; 120,000 shares authorized; 65,707 shares issued at July 3, 2026 and January 2, 2026
- 66,000 US dollars
- Treasury stock, at cost; 18,176 and 16,087 shares held at July 3, 2026 and January 2, 2026, respectively
- negative 795,045,000 US dollars
- Foreign currency translation adjustments
- negative 2,378,000 US dollars
- Gross equity (calculated)
- 1,086,039,000 US dollars. Net equity plus the magnitudes of its negative contributions equals gross positive equity. The negative contributions enter this reconciliation as add-backs; their filed signs stay negative.
Chart connections
- Assets equal liabilities plus consolidated equity. Consolidated equity includes noncontrolling interests when reported.
- Treasury shares and other negative equity contributions reduce equity.
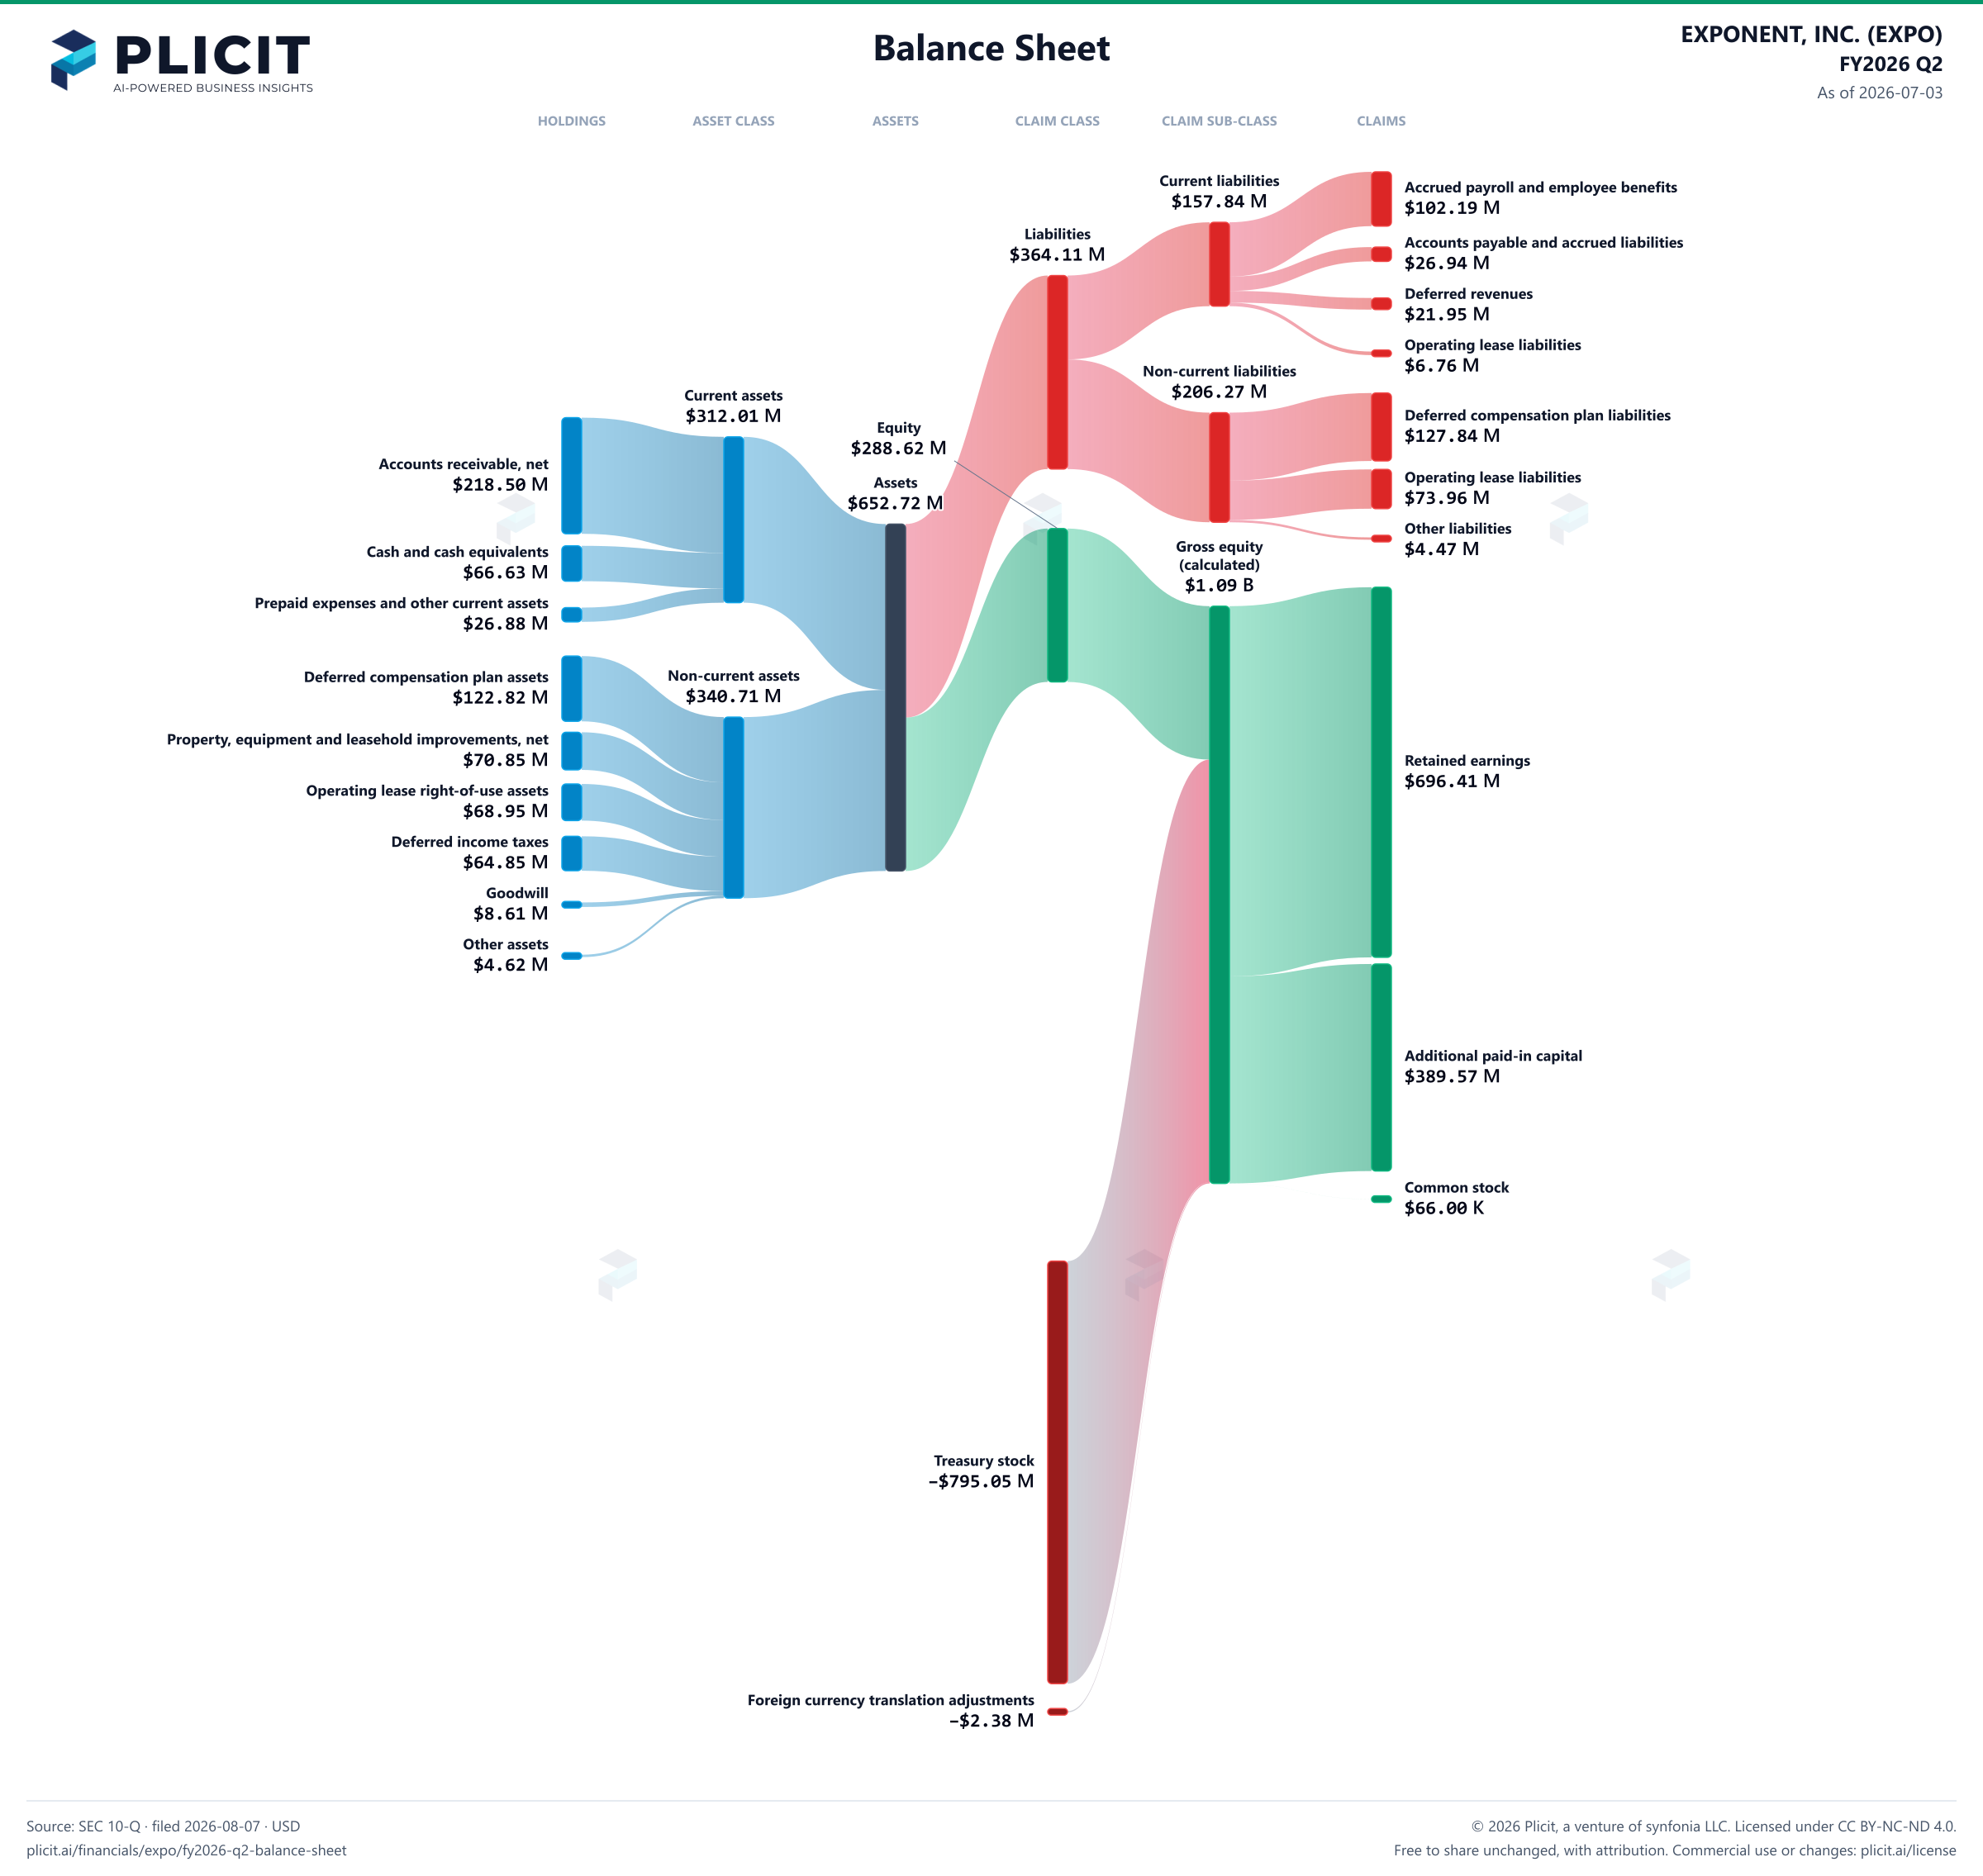
Free to share unchanged, with credit to Plicit.ai · CC BY-NC-ND 4.0Download PNG
Product waitlist
Health Check and Teardown for your own company
A health check uncovers insights of your private books, not a public ticker. Join this list to get notified as soon as we go-live!