
Published Source: Form 10-Q on SEC EDGAR filed (opens in a new tab)

As of 2026-03-31

Balance Sheet

Swipe to see the full flow
Ford Motor Co (F) FY2026 Q1 Balance SheetBalance sheet as of 2026-03-31. The chart shows assets, liabilities and equity at that date.Current liabilities$106.68 BLiabilities$244.95 BCurrent assets$116.33 BNon-current liabilities$138.27 BAssets$282.43 BNon-current assets$166.11 BEquity$37.48 BHOLDINGSASSET CLASSASSETSCLAIM CLASSCLAIM SUB-CLASSCLAIMSFord Credit finance receivables, net of allowance for credit losses of $261 and $270 (Note 8)Cash and cash equivalents (Note 7)Trade and other receivables, less allowances of $108 and $100Inventories (Note 9)Marketable securities (Note 7)Other assetsFord Credit finance receivables, net of allowance for credit losses of $650 and $667 (Note 8)Net propertyNet investment in operating leasesDeferred income taxesOther assetsEquity in net assets of affiliated companiesDebt payable within one year (Note 12) - Ford CreditOther liabilities and deferred revenue (Note 10 and Note 17)PayablesDebt payable within one year (Note 12) - Company excluding Ford CreditLong-term debt (Note 12) - Ford CreditOther liabilities and deferred revenue (Note 10 and Note 17)Long-term debt (Note 12) - Company excluding Ford CreditDeferred income taxesRetained earningsCapital in excess of par value of stockCommon stock, value - Common StockEquity attributable to noncontrolling interestsCommon stock, value - Class B StockAccumulated other comprehensive income/(loss) (Note 15)Treasury stockCurrent assetsNon-current assetsAssetsCurrent liabilitiesNon-current liabilitiesLiabilitiesEquityEquityDebt payable within one year (Note 12) - Ford CreditDebt payable within one year (Note 12) - Ford Credit$47.52 BCurrent liabilitiesCurrent liabilities$106.68 BFord Credit finance receivables, net of allowance for credit losses of $261 and $270 (Note 8)Ford Credit finance receivables, net$46.19 BOther liabilities and deferred revenue (Note 10 and Note 17)Other liabilities and deferred revenue$29.85 BLiabilitiesLiabilities$244.95 BPayablesPayables$26.04 BCash and cash equivalents (Note 7)Cash and cash equivalents (Note 7)$17.65 BCurrent assetsCurrent assets$116.33 BDebt payable within one year (Note 12) - Company excluding Ford CreditDebt payable within one year (Note12) - Company excluding Ford Credit$3.27 BTrade and other receivables, less allowances of $108 and $100Trade and other receivables, net$17.23 BInventories (Note 9)Inventories (Note 9)$16.54 BNon-current liabilitiesNon-current liabilities$138.27 BAssetsAssets$282.43 BLong-term debt (Note 12) - Ford CreditLong-term debt (Note 12) - Ford Credit$90.01 BMarketable securities (Note 7)Marketable securities (Note 7)$12.84 BOther liabilities and deferred revenue (Note 10 and Note 17)Other liabilities and deferred revenue$30.16 BOther assetsOther assets$5.89 BLong-term debt (Note 12) - Company excluding Ford CreditLong-term debt - Company excluding Ford Credit$16.33 BDeferred income taxesDeferred income taxes$1.78 BFord Credit finance receivables, net of allowance for credit losses of $650 and $667 (Note 8)Ford Credit finance receivables, net$60.32 BNon-current assetsNon-current assets$166.11 BRetained earningsRetained earnings$24.45 BNet propertyNet property$38.09 BEquityEquity$37.48 BCapital in excess of par value of stockCapital in excess of par value of stock$23.88 BNet investment in operating leasesNet investment in operating leases$28.98 BCommon stock, value - Common StockCommon stock, value - Common Stock$42.00 MDeferred income taxesDeferred income taxes$22.27 BEquity attributable to noncontrolling interestsEquity attributable to noncontrolling interests$31.00 MOther assetsOther assets$13.70 BCommon stock, value - Class B StockCommon stock, value - Class B Stock$1.00 MAccumulated other comprehensive income/(loss) (Note 15)Other comprehensive loss−$7.88 BEquity in net assets of affiliated companiesEquity in net assets of affiliated companies$2.74 BTreasury stockBought back (treasury stock)−$3.04 B
Chart details

Ford Motor Co (F) FY2026 Q1 Balance Sheet

Balance sheet as of 2026-03-31. The chart shows assets, liabilities and equity at that date.

Assets
282,434,000,000 US dollars
Current assets
116,329,000,000 US dollars
Non-current assets
166,105,000,000 US dollars
Liabilities
244,950,000,000 US dollars
Current liabilities
106,679,000,000 US dollars
Non-current liabilities
138,271,000,000 US dollars
Equity
37,484,000,000 US dollars
Noncontrolling interest
31,000,000 US dollars. Included in consolidated equity; this amount is not added again.
Ford Credit finance receivables, net of allowance for credit losses of $261 and $270 (Note 8)
46,185,000,000 US dollars
Cash and cash equivalents (Note 7)
17,649,000,000 US dollars
Trade and other receivables, less allowances of $108 and $100
17,227,000,000 US dollars
Inventories (Note 9)
16,537,000,000 US dollars
Marketable securities (Note 7)
12,839,000,000 US dollars
Other assets
5,892,000,000 US dollars
Ford Credit finance receivables, net of allowance for credit losses of $650 and $667 (Note 8)
60,322,000,000 US dollars
Net property
38,091,000,000 US dollars
Net investment in operating leases
28,983,000,000 US dollars
Deferred income taxes
22,273,000,000 US dollars
Other assets
13,699,000,000 US dollars
Equity in net assets of affiliated companies
2,737,000,000 US dollars
Debt payable within one year (Note 12) - Ford Credit
47,523,000,000 US dollars
Other liabilities and deferred revenue (Note 10 and Note 17)
29,849,000,000 US dollars
Payables
26,039,000,000 US dollars
Debt payable within one year (Note 12) - Company excluding Ford Credit
3,268,000,000 US dollars
Long-term debt (Note 12) - Ford Credit
90,008,000,000 US dollars
Other liabilities and deferred revenue (Note 10 and Note 17)
30,161,000,000 US dollars
Long-term debt (Note 12) - Company excluding Ford Credit
16,327,000,000 US dollars
Deferred income taxes
1,775,000,000 US dollars
Retained earnings
24,445,000,000 US dollars
Capital in excess of par value of stock
23,884,000,000 US dollars
Common stock, value - Common Stock
42,000,000 US dollars
Common stock, value - Class B Stock
1,000,000 US dollars
Equity attributable to noncontrolling interests
31,000,000 US dollars
Accumulated other comprehensive income/(loss) (Note 15)
negative 7,880,000,000 US dollars
Treasury stock
negative 3,039,000,000 US dollars

Chart connections

  • Assets equal liabilities plus consolidated equity. Consolidated equity includes noncontrolling interests when reported.
  • Treasury shares and other negative equity contributions reduce equity.
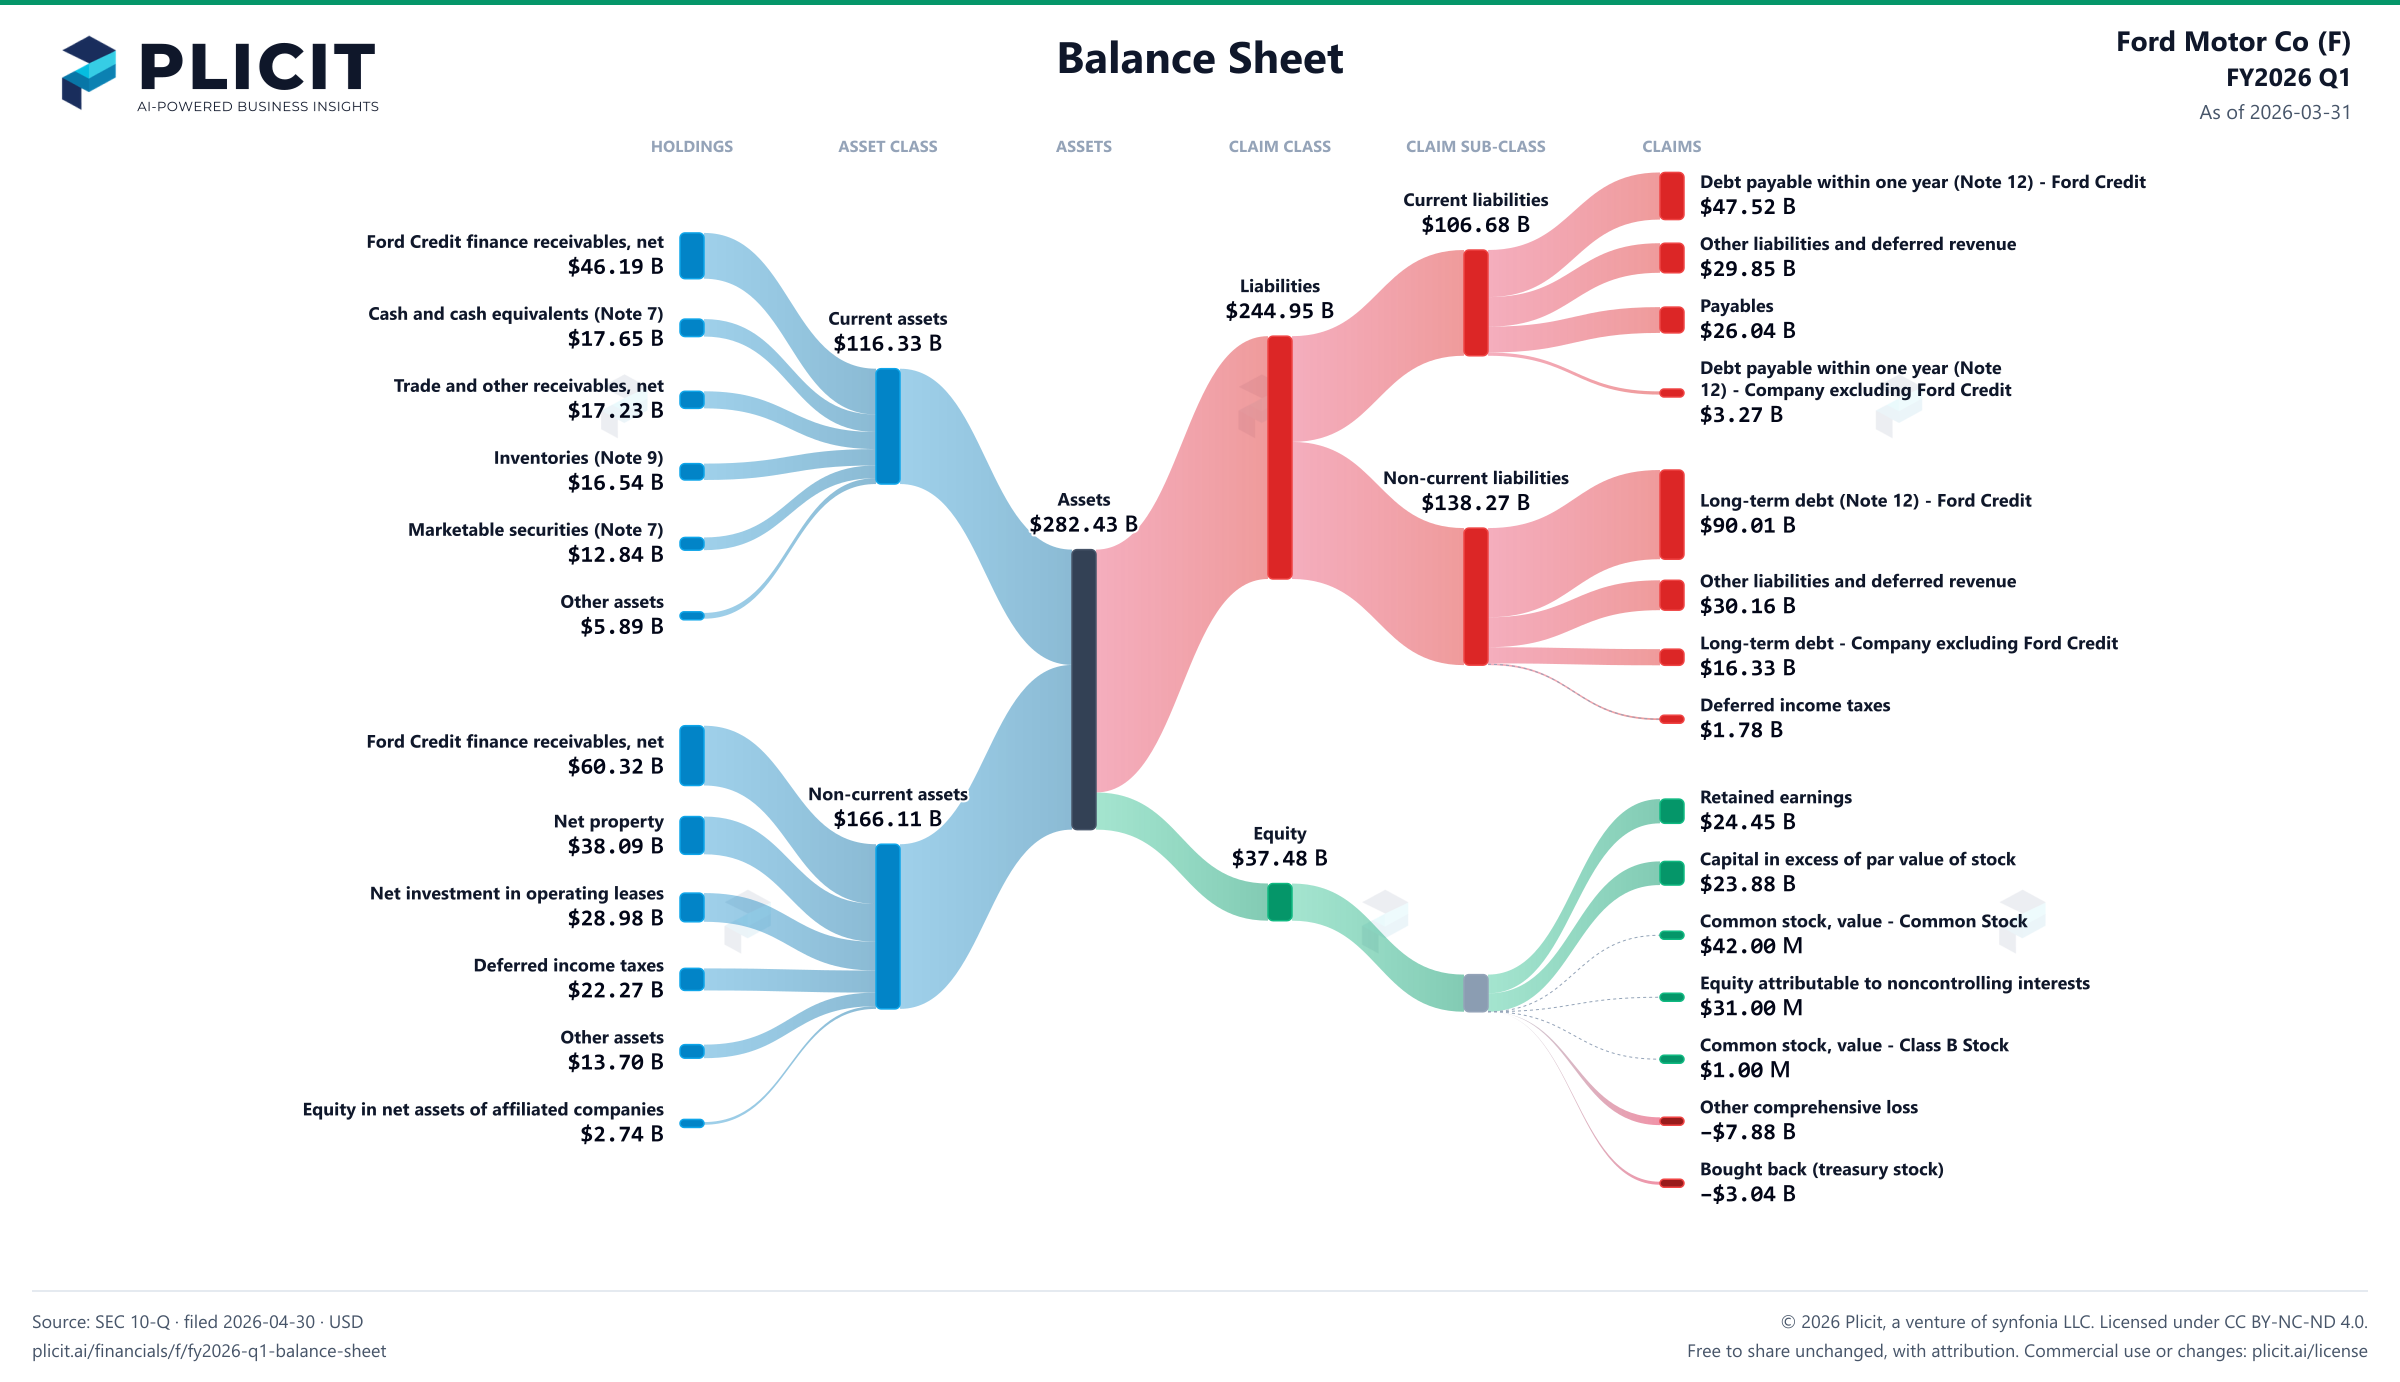
Ford Motor Co (F) FY2026 Q1 Balance Sheet Sankey chart
Free to share unchanged, with credit to Plicit.ai · CC BY-NC-ND 4.0Download PNG

Product waitlist

Health Check and Teardown for your own company

A health check uncovers insights of your private books, not a public ticker. Join this list to get notified as soon as we go-live!