
FRANKLIN ELECTRIC CO., INC. (FELE) FY2026 Q2 Balance Sheet
Published Source: Form 10-Q on SEC EDGAR filed (opens in a new tab)
Balance Sheet
Swipe to see the full flow
Chart details
FRANKLIN ELECTRIC CO., INC. (FELE) FY2026 Q2 Balance Sheet
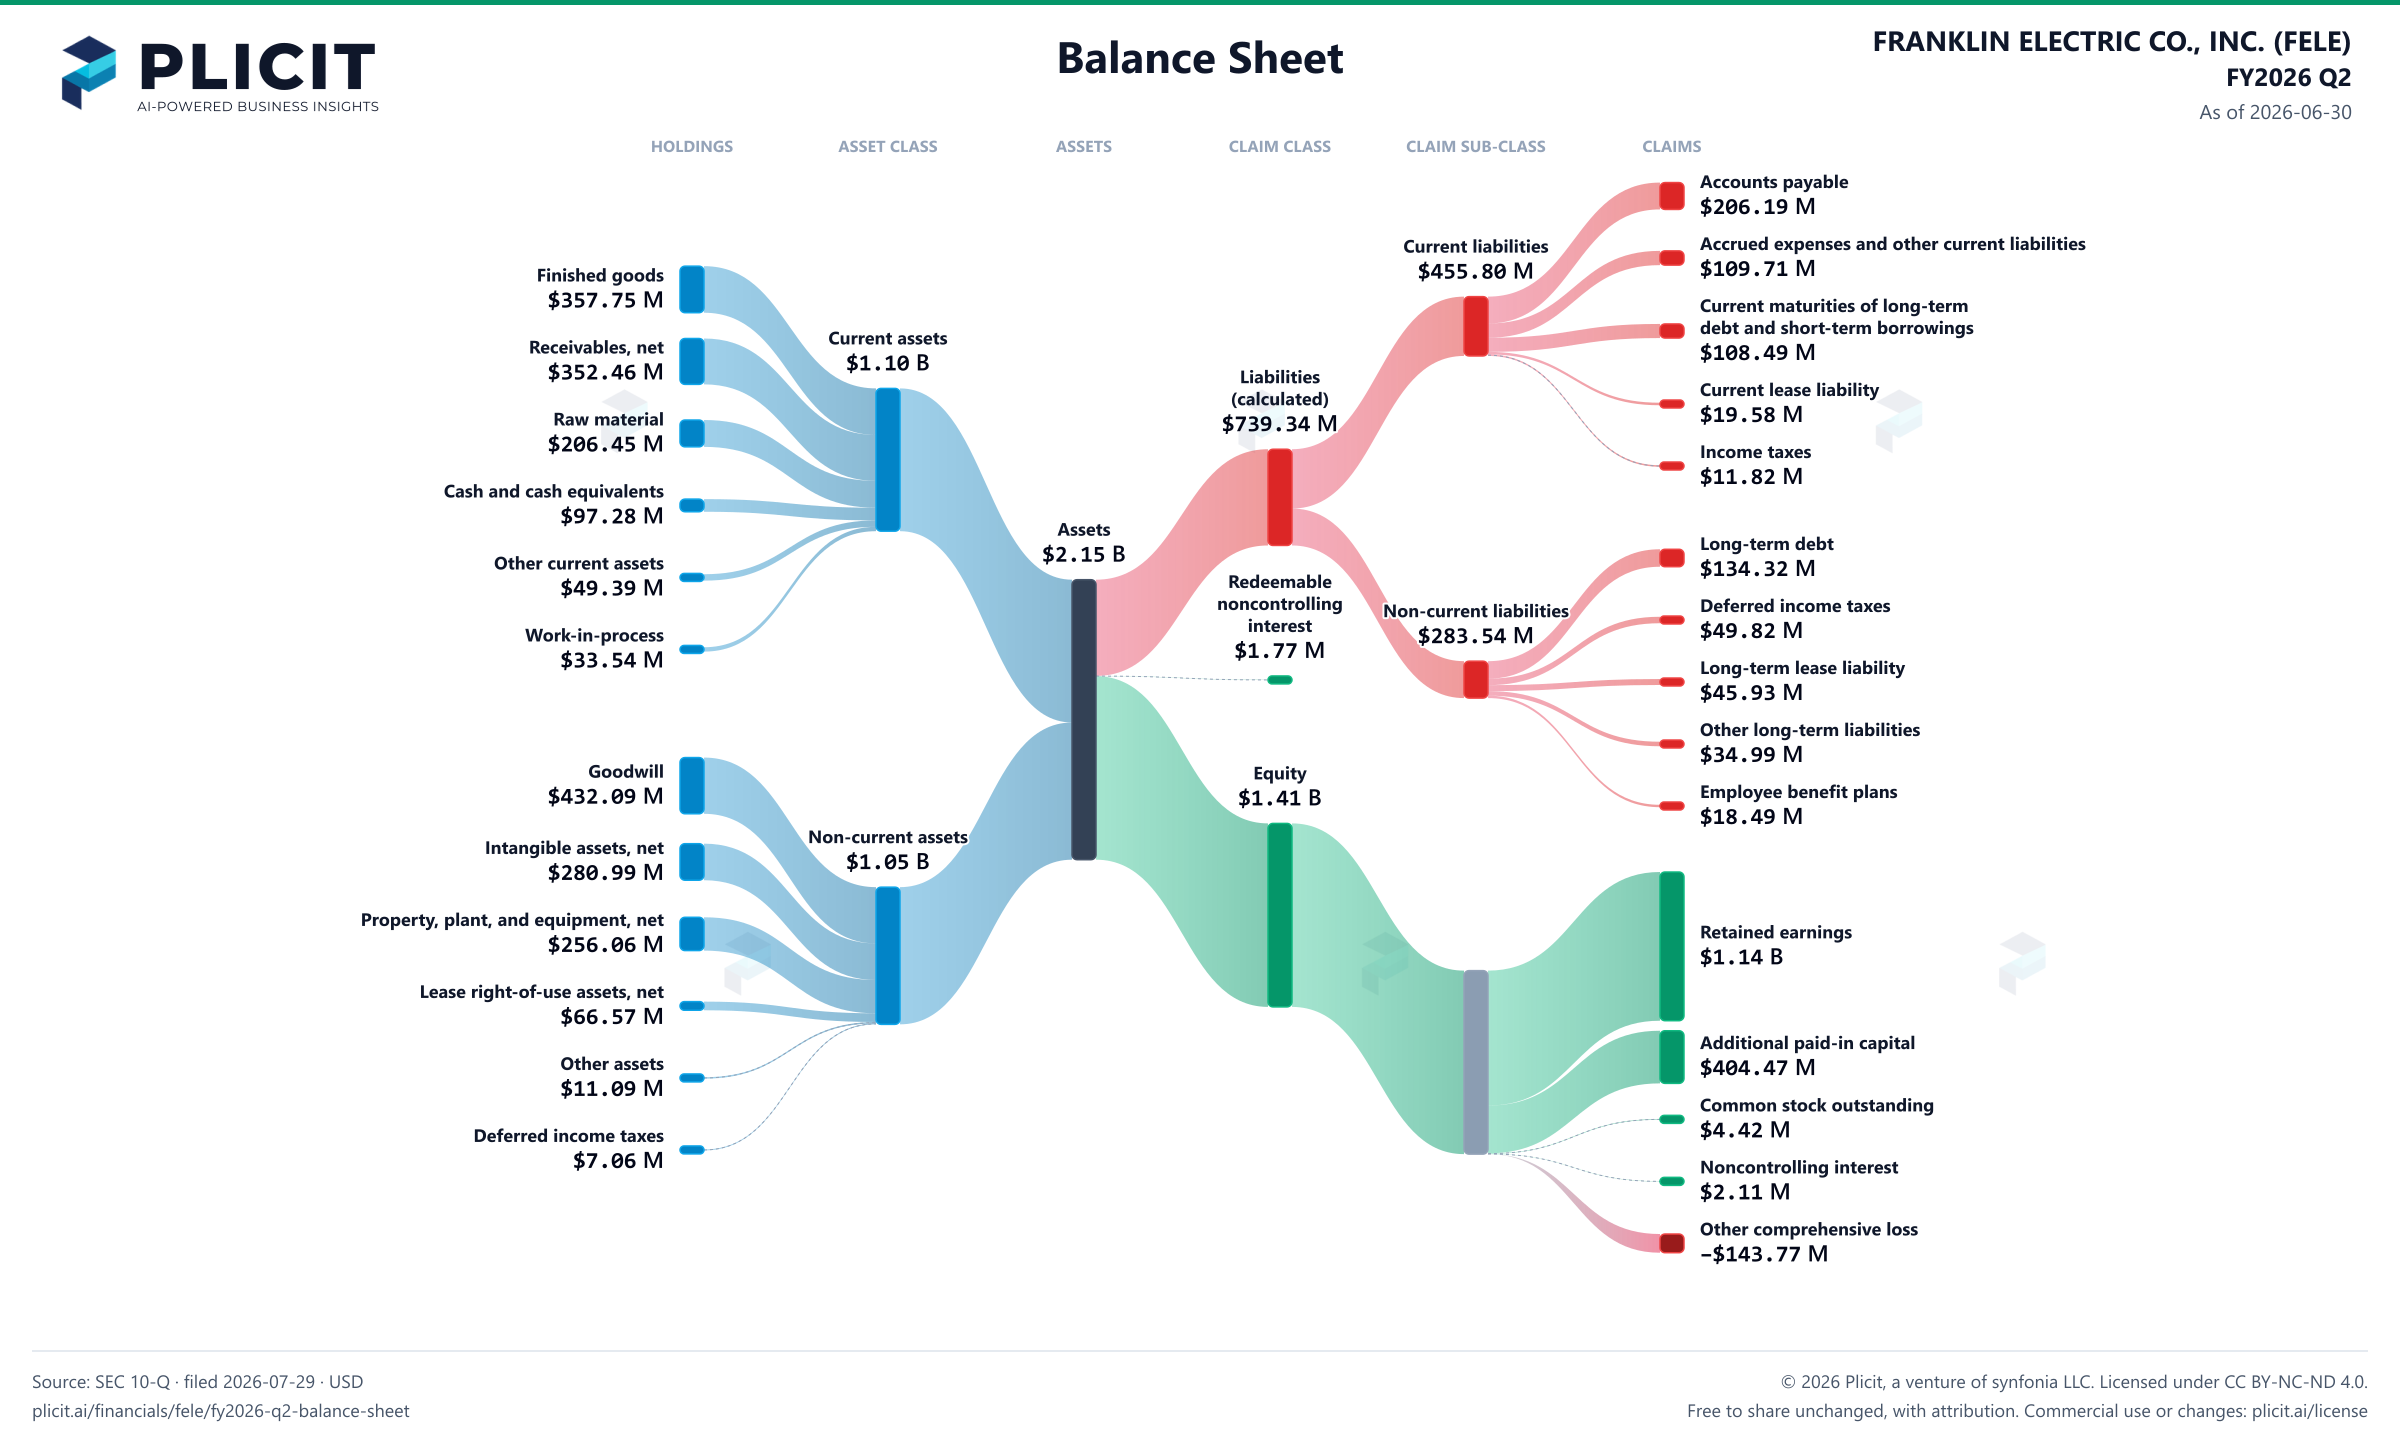
Balance sheet as of 2026-06-30. The chart shows assets, liabilities and equity at that date.
- Assets
- 2,150,732,000 US dollars
- Current assets
- 1,096,868,000 US dollars
- Non-current assets
- 1,053,864,000 US dollars
- Liabilities (calculated)
- 739,341,000 US dollars
- Current liabilities
- 455,797,000 US dollars
- Non-current liabilities
- 283,544,000 US dollars
- Equity
- 1,409,621,000 US dollars
- Redeemable noncontrolling interest
- 1,770,000 US dollars
- Noncontrolling interest
- 2,112,000 US dollars. Included in consolidated equity; this amount is not added again.
- Land and buildings
- 189,745,000 US dollars. Part of Property, plant, and equipment, net, drawn as one net amount.
- Machinery and equipment
- 360,657,000 US dollars. Part of Property, plant, and equipment, net, drawn as one net amount.
- Furniture and fixtures
- 62,152,000 US dollars. Part of Property, plant, and equipment, net, drawn as one net amount.
- Other
- 78,670,000 US dollars. Part of Property, plant, and equipment, net, drawn as one net amount.
- Less: Allowance for depreciation
- negative 435,160,000 US dollars. Part of Property, plant, and equipment, net, drawn as one net amount.
- Finished goods
- 357,754,000 US dollars
- Receivables, less allowances of $3,260 and $3,821, respectively
- 352,459,000 US dollars
- Raw material
- 206,446,000 US dollars
- Cash and cash equivalents
- 97,283,000 US dollars
- Other current assets
- 49,390,000 US dollars
- Work-in-process
- 33,536,000 US dollars
- Goodwill
- 432,092,000 US dollars
- Intangible assets, net
- 280,986,000 US dollars
- Property, plant, and equipment, net
- 256,064,000 US dollars
- Lease right-of-use assets, net
- 66,574,000 US dollars
- Other assets
- 11,086,000 US dollars
- Deferred income taxes
- 7,062,000 US dollars
- Accounts payable
- 206,192,000 US dollars
- Accrued expenses and other current liabilities
- 109,712,000 US dollars
- Current maturities of long-term debt and short-term borrowings
- 108,491,000 US dollars
- Current lease liability
- 19,580,000 US dollars
- Income taxes
- 11,822,000 US dollars
- Long-term debt
- 134,317,000 US dollars
- Deferred income taxes
- 49,817,000 US dollars
- Long-term lease liability
- 45,930,000 US dollars
- Other long-term liabilities
- 34,994,000 US dollars
- Employee benefit plans
- 18,486,000 US dollars
- Retained earnings
- 1,142,388,000 US dollars
- Additional paid-in capital
- 404,470,000 US dollars
- Common stock (65,000 shares authorized, $.10 par value) outstanding (44,214 and 44,178, respectively)
- 4,421,000 US dollars
- Noncontrolling interest
- 2,112,000 US dollars
- Accumulated other comprehensive loss
- negative 143,770,000 US dollars
Chart connections
- Assets equal liabilities plus temporary equity plus consolidated equity. Consolidated equity includes noncontrolling interests when reported.
- Treasury shares and other negative equity contributions reduce equity.
Free to share unchanged, with credit to Plicit.ai · CC BY-NC-ND 4.0Download PNG
Product waitlist
Health Check and Teardown for your own company
A health check uncovers insights of your private books, not a public ticker. Join this list to get notified as soon as we go-live!