
Federated Hermes, Inc. (FHI) FY2026 Q3 Balance Sheet

Published Source: Form 10-Q on SEC EDGAR filed (opens in a new tab)

As of 2026-09-30

Balance Sheet

Swipe to see the full flow
Federated Hermes, Inc. (FHI) FY2026 Q3 Balance SheetBalance sheet as of 2026-09-30. The chart shows assets, liabilities and equity at that date.Current liabilities$299.65 MLiabilities$1.00 BCurrent assets$742.60 MNon-current liabilities$704.57 MAssets$2.47 BRedeemableNoncontrollingInterests in…$171.94 MEquity$1.29 BNon-current assets$1.72 BHOLDINGSASSET CLASSASSETSCLAIM CLASSCLAIM SUB-CLASSCLAIMSCash and Cash EquivalentsInvestments - Investments—Consolidated Investment CompaniesReceivables - Receivables, net of reserve of $21 and $21, respectivelyInvestments - AffiliatesReceivables - AffiliatesPrepaid ExpensesOther Current AssetsGoodwillIntangible Assets, net of accumulated amortization of $108,498 and $95,365, respectivelyRight-of-Use Assets, netOther Long-Term AssetsProperty and Equipment, net of accumulated depreciation of $87,234 and $86,955, respectivelyAccrued Compensation and BenefitsAccounts Payable and Accrued ExpensesOther Current LiabilitiesLease LiabilitiesLong-Term DebtLong-Term Deferred Tax Liability, netLong-Term Lease LiabilitiesOther Long-Term LiabilitiesRetained EarningsCommon Stock - Class BAdditional Paid-In CapitalCommon Stock - Class ATreasury Stock, at Cost, 25,583,774 and 23,118,490 Shares Class B Common Stock, respectivelyAccumulated Other Comprehensive Income (Loss), net of taxCurrent assetsNon-current assetsAssetsCurrent liabilitiesNon-current liabilitiesLiabilitiesRedeemable Noncontrolling Interests in SubsidiariesEquityEquityAccrued Compensation and BenefitsAccrued Compensation and Benefits$146.99 MCash and Cash EquivalentsCash and Cash Equivalents$373.66 MCurrent liabilitiesCurrent liabilities$299.65 MAccounts Payable and Accrued ExpensesAccounts Payable and Accrued Expenses$97.57 MInvestments - Investments—Consolidated Investment CompaniesInvestments - Investments—ConsolidatedInvestment Companies$149.78 MOther Current LiabilitiesOther Current Liabilities$35.22 MLiabilitiesLiabilities$1.00 BCurrent assetsCurrent assets$742.60 MLease LiabilitiesLease Liabilities$19.87 MReceivables - Receivables, net of reserve of $21 and $21, respectivelyReceivables - Receivables, net$74.01 MInvestments - AffiliatesInvestments - Affiliates$56.83 MLong-Term DebtLong-Term Debt$348.57 MNon-current liabilitiesNon-current liabilities$704.57 MLong-Term Deferred Tax Liability, netLong-Term Deferred Tax Liability, net$179.38 MReceivables - AffiliatesReceivables - Affiliates$46.07 MAssetsAssets$2.47 BLong-Term Lease LiabilitiesLong-Term Lease Liabilities$126.45 MPrepaid ExpensesPrepaid Expenses$39.64 MRedeemable Noncontrolling Interests in SubsidiariesRedeemableNoncontrollingInterests in…$171.94 MOther Long-Term LiabilitiesOther Long-Term Liabilities$50.16 MOther Current AssetsOther Current Assets$2.61 MEquityEquity$1.29 BRetained EarningsRetained Earnings$1.75 BGoodwillGoodwill$1.11 BNon-current assetsNon-current assets$1.72 BCommon Stock - Class BCommon Stock - Class B$556.79 MAdditional Paid-In CapitalAdditional Paid-In Capital$15.07 MIntangible Assets, net of accumulated amortization of $108,498 and $95,365, respectivelyIntangible Assets, net$385.07 MCommon Stock - Class ACommon Stock - Class A$189.00 KRight-of-Use Assets, netRight-of-Use Assets, net$122.25 MOther Long-Term AssetsOther Long-Term Assets$53.77 MTreasury Stock, at Cost, 25,583,774 and 23,118,490 Shares Class B Common Stock, respectivelyBought back (treasury stock)−$1.03 BProperty and Equipment, net of accumulated depreciation of $87,234 and $86,955, respectivelyProperty and Equipment, net$49.13 MAccumulated Other Comprehensive Income (Loss), net of taxOther comprehensive loss−$1.60 M
Chart details

Federated Hermes, Inc. (FHI) FY2026 Q3 Balance Sheet

Balance sheet as of 2026-09-30. The chart shows assets, liabilities and equity at that date.

Assets
2,467,077,000 US dollars
Current assets
742,598,000 US dollars
Non-current assets
1,724,479,000 US dollars
Liabilities
1,004,214,000 US dollars
Current liabilities
299,649,000 US dollars
Non-current liabilities
704,565,000 US dollars
Equity
1,290,920,000 US dollars
Redeemable Noncontrolling Interests in Subsidiaries
171,943,000 US dollars
Cash and Cash Equivalents
373,664,000 US dollars
Investments - Investments—Consolidated Investment Companies
149,781,000 US dollars
Receivables - Receivables, net of reserve of $21 and $21, respectively
74,010,000 US dollars
Investments - Affiliates
56,826,000 US dollars
Receivables - Affiliates
46,073,000 US dollars
Prepaid Expenses
39,638,000 US dollars
Other Current Assets
2,606,000 US dollars
Goodwill
1,114,261,000 US dollars
Intangible Assets, net of accumulated amortization of $108,498 and $95,365, respectively
385,072,000 US dollars
Right-of-Use Assets, net
122,251,000 US dollars
Other Long-Term Assets
53,765,000 US dollars
Property and Equipment, net of accumulated depreciation of $87,234 and $86,955, respectively
49,130,000 US dollars
Accrued Compensation and Benefits
146,992,000 US dollars
Accounts Payable and Accrued Expenses
97,570,000 US dollars
Other Current Liabilities
35,215,000 US dollars
Lease Liabilities
19,872,000 US dollars
Long-Term Debt
348,565,000 US dollars
Long-Term Deferred Tax Liability, net
179,384,000 US dollars
Long-Term Lease Liabilities
126,454,000 US dollars
Other Long-Term Liabilities
50,162,000 US dollars
Retained Earnings
1,752,262,000 US dollars
Common Stock - Class B
556,792,000 US dollars
Additional Paid-In Capital
15,070,000 US dollars
Common Stock - Class A
189,000 US dollars
Treasury Stock, at Cost, 25,583,774 and 23,118,490 Shares Class B Common Stock, respectively
negative 1,031,794,000 US dollars
Accumulated Other Comprehensive Income (Loss), net of tax
negative 1,599,000 US dollars

Chart connections

  • Assets equal liabilities plus temporary equity plus consolidated equity. Consolidated equity includes noncontrolling interests when reported.
  • Treasury shares and other negative equity contributions reduce equity.
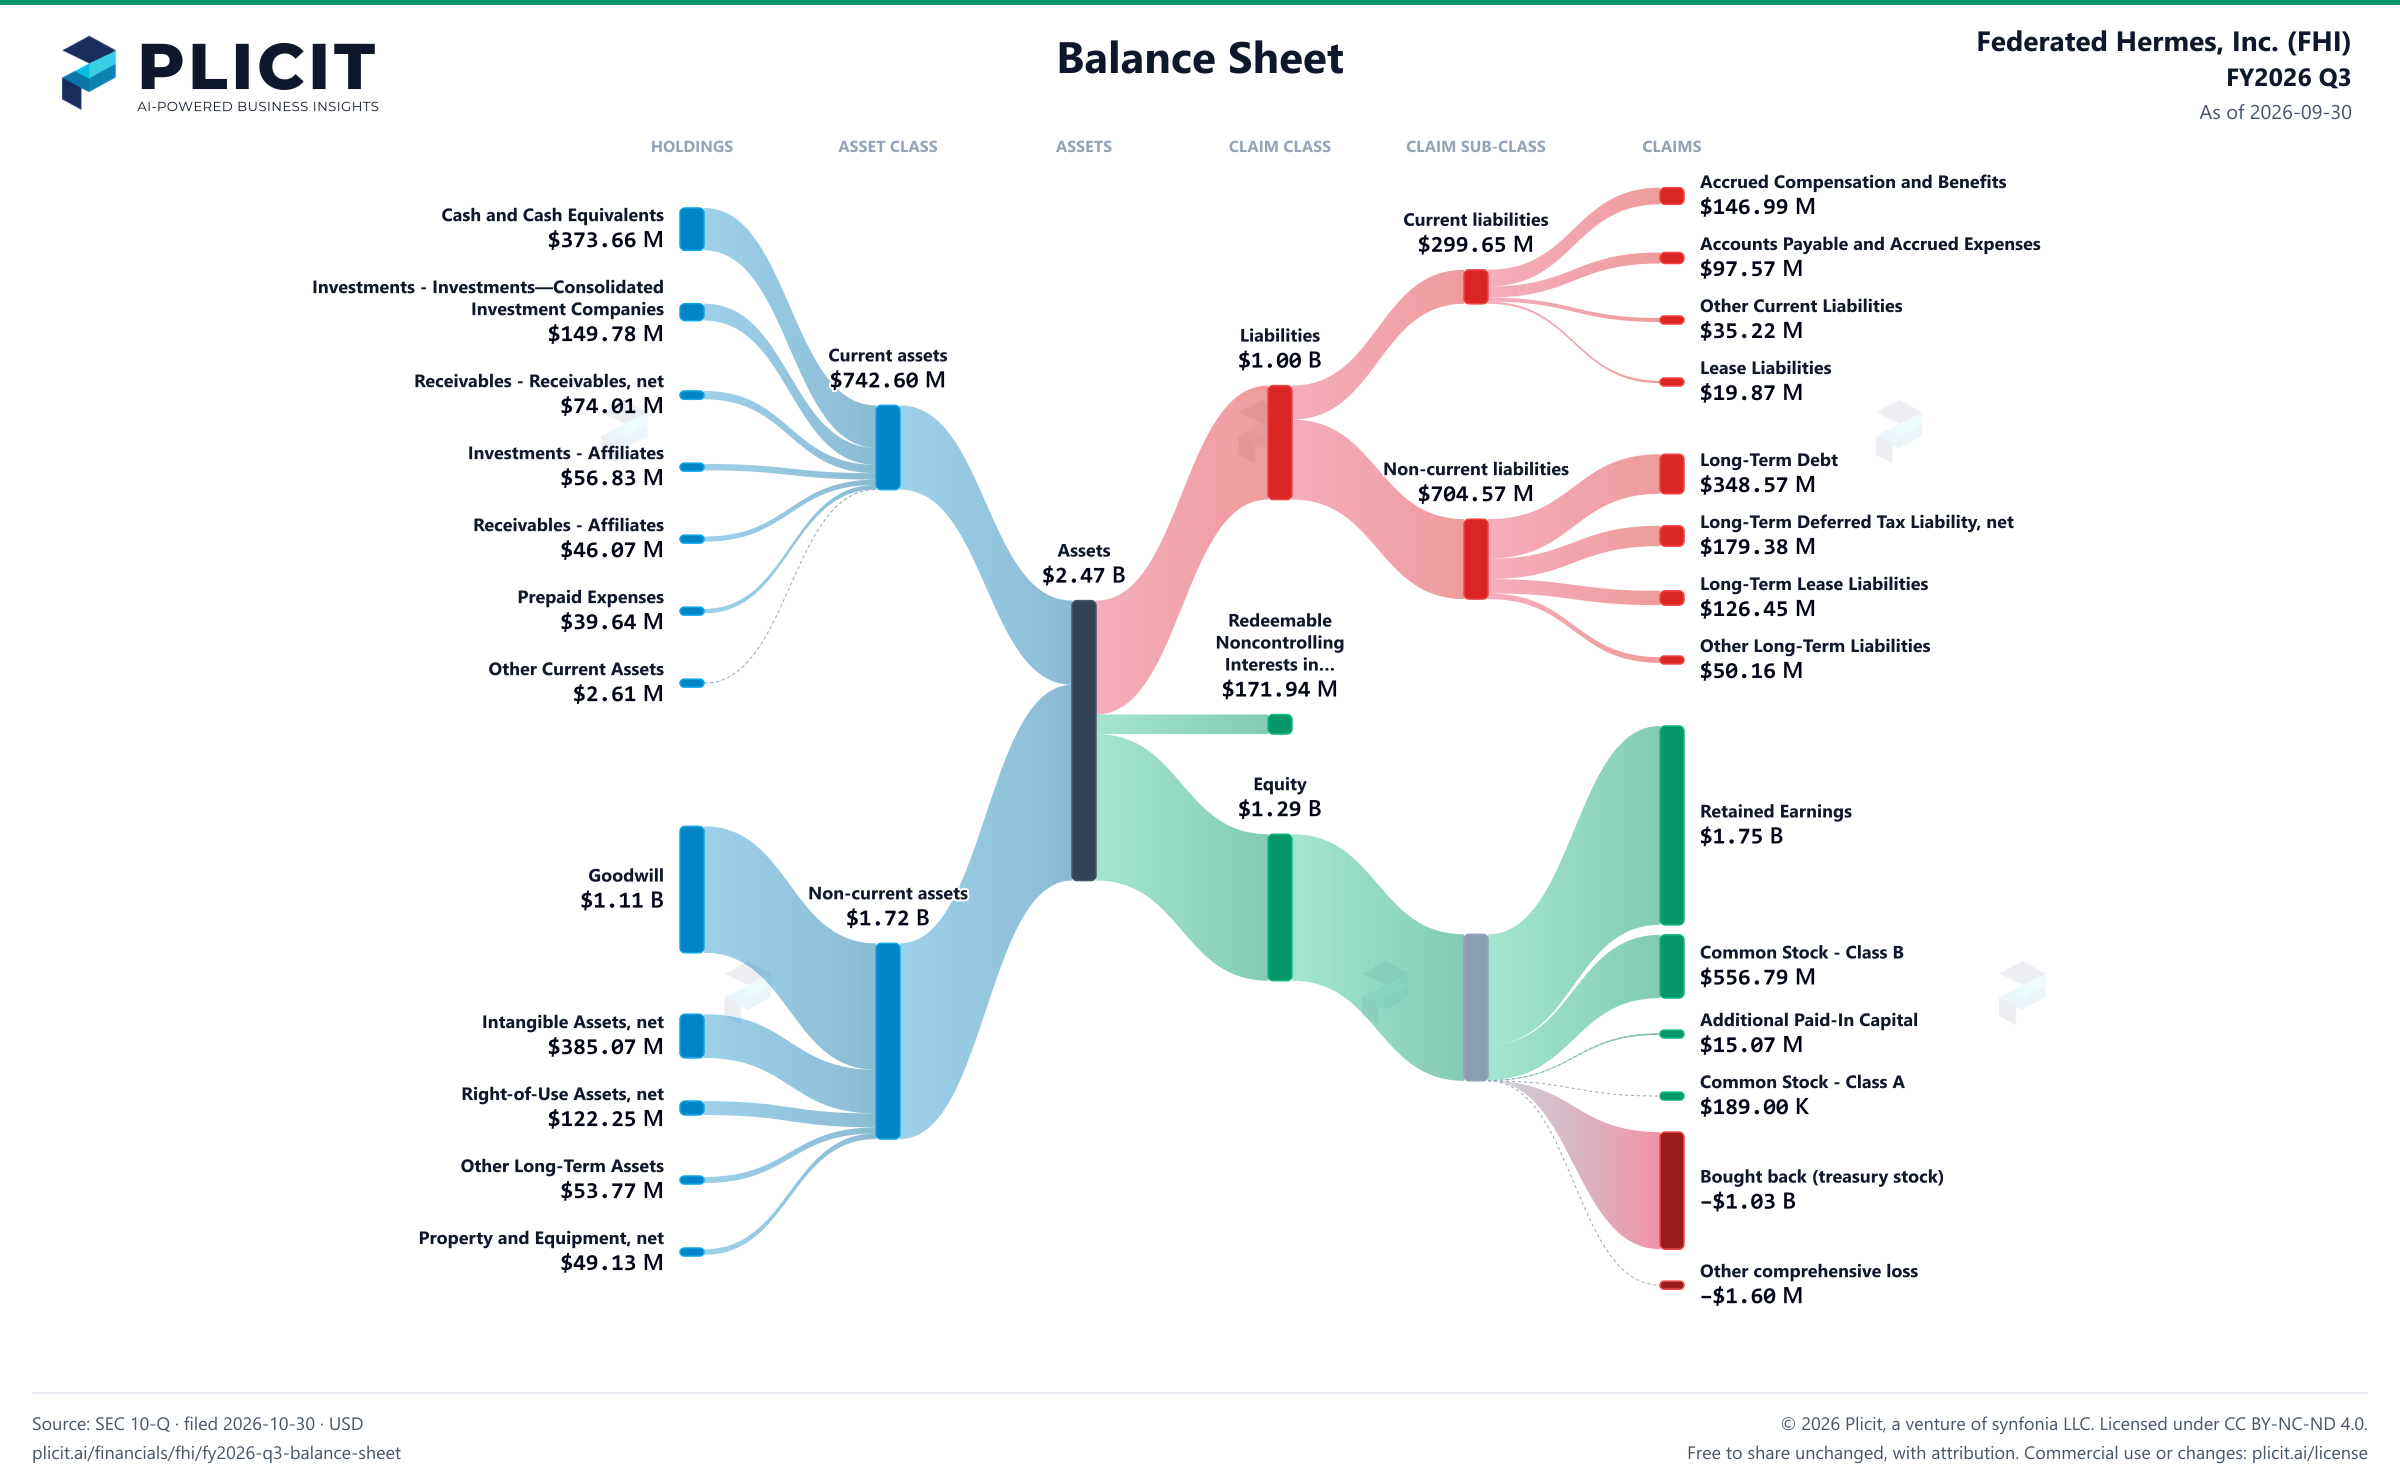
Federated Hermes, Inc. (FHI) FY2026 Q3 Balance Sheet Sankey chart
Free to share unchanged, with credit to Plicit.ai · CC BY-NC-ND 4.0Download PNG

Product waitlist

Health Check and Teardown for your own company

A health check uncovers insights of your private books, not a public ticker. Join this list to get notified as soon as we go-live!