
COMFORT SYSTEMS USA, INC. (FIX) FY2026 Q1 Balance Sheet

Balance Sheet

As of 2026-03-31

Swipe to see the full flow
COMFORT SYSTEMS USA, INC. (FIX) FY2026 Q1 Balance SheetBalance sheet as of 2026-03-31. The chart shows assets, liabilities and equity at that date.Current liabilities$3.63 BCurrent assets$4.50 BLiabilities$4.12 BAssets$6.94 BNon-current liabilities$492.51 MEquity$2.82 BNon-current assets$2.44 BGross equity(calculated)$3.32 BHOLDINGSASSET CLASSASSETSCLAIM CLASSCLAIM SUB-CLASSCLAIMSBilled accounts receivable, less allowance for credit losses of $19,991 and $19,708, respectivelyCash and cash equivalentsPrepaid expenses and otherUnbilled accounts receivable, less allowance for credit losses of $1,746 and $1,508, respectivelyCosts and estimated earnings in excess of billings, less allowance for credit losses of $505 and $255, respectivelyOther receivables, less allowance for credit losses of $267 and $325, respectivelyInventoriesGOODWILLPROPERTY AND EQUIPMENT, NETIDENTIFIABLE INTANGIBLE ASSETS, NETLEASE RIGHT-OF-USE ASSETSDEFERRED TAX ASSETSOTHER NONCURRENT ASSETSBillings in excess of costs and estimated earnings and deferred revenueAccounts payableAccrued compensation and benefitsOther current liabilitiesAccrued self-insuranceCurrent maturities of long-term debtLEASE LIABILITIESOTHER LONG-TERM LIABILITIESLONG-TERM DEBTDEFERRED TAX LIABILITIESRetained earningsAdditional paid-in capitalCommon stock, $.01 par, 102,969,912 shares authorized, 41,123,365 and 41,123,365 shares issued, respectivelyCurrent assetsNon-current assetsAssetsCurrent liabilitiesNon-current liabilitiesLiabilitiesEquityGross equity (calculated)Treasury stock, at cost, 5,936,242 and 5,946,145 shares, respectivelyBillings in excess of costs and estimated earnings and deferred revenueBillings in excess of costs andestimated earnings and deferred revenue$2.35 BCurrent liabilitiesCurrent liabilities$3.63 BBilled accounts receivable, less allowance for credit losses of $19,991 and $19,708, respectivelyBilled accounts receivable, net$2.81 BCurrent assetsCurrent assets$4.50 BAccounts payableAccounts payable$719.59 MLiabilitiesLiabilities$4.12 BAccrued compensation and benefitsAccrued compensation and benefits$278.18 MCash and cash equivalentsCash and cash equivalents$1.05 BAssetsAssets$6.94 BOther current liabilitiesOther current liabilities$249.78 MPrepaid expenses and otherPrepaid expenses and other$177.59 MAccrued self-insuranceAccrued self-insurance$37.93 MUnbilled accounts receivable, less allowance for credit losses of $1,746 and $1,508, respectivelyUnbilled accounts receivable, net$137.07 MCurrent maturities of long-term debtCurrent maturities of long-term debt$25.00 KCosts and estimated earnings in excess of billings, less allowance for credit losses of $505 and $255, respectivelyCosts and estimated earnings in excess of billings, net$128.01 MLEASE LIABILITIESLEASE LIABILITIES$300.01 MOther receivables, less allowance for credit losses of $267 and $325, respectivelyOther receivables, net$108.89 MNon-current liabilitiesNon-current liabilities$492.51 MOTHER LONG-TERM LIABILITIESOTHER LONG-TERM LIABILITIES$149.55 MInventoriesInventories$93.95 MEquityEquity$2.82 BLONG-TERM DEBTLONG-TERM DEBT$39.05 MGOODWILLGOODWILL$1.03 BDEFERRED TAX LIABILITIESDEFERRED TAX LIABILITIES$3.89 MNon-current assetsNon-current assets$2.44 BGross equity (calculated)Gross equity(calculated)$3.32 BPROPERTY AND EQUIPMENT, NETPROPERTY AND EQUIPMENT, NET$515.80 MIDENTIFIABLE INTANGIBLE ASSETS, NETIDENTIFIABLE INTANGIBLE ASSETS, NET$464.77 MRetained earningsRetained earnings$2.93 BLEASE RIGHT-OF-USE ASSETSLEASE RIGHT-OF-USE ASSETS$321.65 MDEFERRED TAX ASSETSDEFERRED TAX ASSETS$83.18 MAdditional paid-in capitalAdditional paid-in capital$388.28 MOTHER NONCURRENT ASSETSOTHER NONCURRENT ASSETS$26.50 MCommon stock, $.01 par, 102,969,912 shares authorized, 41,123,365 and 41,123,365 shares issued, respectivelyCommon stock$411.00 KTreasury stock, at cost, 5,936,242 and 5,946,145 shares, respectivelyTreasury stock−$500.45 M
Chart details

COMFORT SYSTEMS USA, INC. (FIX) FY2026 Q1 Balance Sheet

Balance sheet as of 2026-03-31. The chart shows assets, liabilities and equity at that date.

Assets
6,938,346,000 US dollars
Current assets
4,500,931,000 US dollars
Non-current assets
2,437,415,000 US dollars
Liabilities
4,123,298,000 US dollars
Current liabilities
3,630,793,000 US dollars
Non-current liabilities
492,505,000 US dollars
Equity
2,815,048,000 US dollars
Billed accounts receivable, less allowance for credit losses of $19,991 and $19,708, respectively
2,805,270,000 US dollars
Cash and cash equivalents
1,050,164,000 US dollars
Prepaid expenses and other
177,588,000 US dollars
Unbilled accounts receivable, less allowance for credit losses of $1,746 and $1,508, respectively
137,070,000 US dollars
Costs and estimated earnings in excess of billings, less allowance for credit losses of $505 and $255, respectively
128,007,000 US dollars
Other receivables, less allowance for credit losses of $267 and $325, respectively
108,885,000 US dollars
Inventories
93,947,000 US dollars
GOODWILL
1,025,515,000 US dollars
PROPERTY AND EQUIPMENT, NET
515,796,000 US dollars
IDENTIFIABLE INTANGIBLE ASSETS, NET
464,774,000 US dollars
LEASE RIGHT-OF-USE ASSETS
321,652,000 US dollars
DEFERRED TAX ASSETS
83,183,000 US dollars
OTHER NONCURRENT ASSETS
26,495,000 US dollars
Billings in excess of costs and estimated earnings and deferred revenue
2,345,279,000 US dollars
Accounts payable
719,590,000 US dollars
Accrued compensation and benefits
278,182,000 US dollars
Other current liabilities
249,784,000 US dollars
Accrued self-insurance
37,933,000 US dollars
Current maturities of long-term debt
25,000 US dollars
LEASE LIABILITIES
300,005,000 US dollars
OTHER LONG-TERM LIABILITIES
149,554,000 US dollars
LONG-TERM DEBT
39,054,000 US dollars
DEFERRED TAX LIABILITIES
3,892,000 US dollars
Retained earnings
2,926,810,000 US dollars
Additional paid-in capital
388,276,000 US dollars
Common stock, $.01 par, 102,969,912 shares authorized, 41,123,365 and 41,123,365 shares issued, respectively
411,000 US dollars
Treasury stock, at cost, 5,936,242 and 5,946,145 shares, respectively
negative 500,449,000 US dollars
Gross equity (calculated)
3,315,497,000 US dollars. Net equity plus the magnitudes of its negative contributions equals gross positive equity. The negative contributions enter this reconciliation as add-backs; their filed signs stay negative.

Chart connections

  • Assets equal liabilities plus consolidated equity. Consolidated equity includes noncontrolling interests when reported.
  • Treasury shares and other negative equity contributions reduce equity.
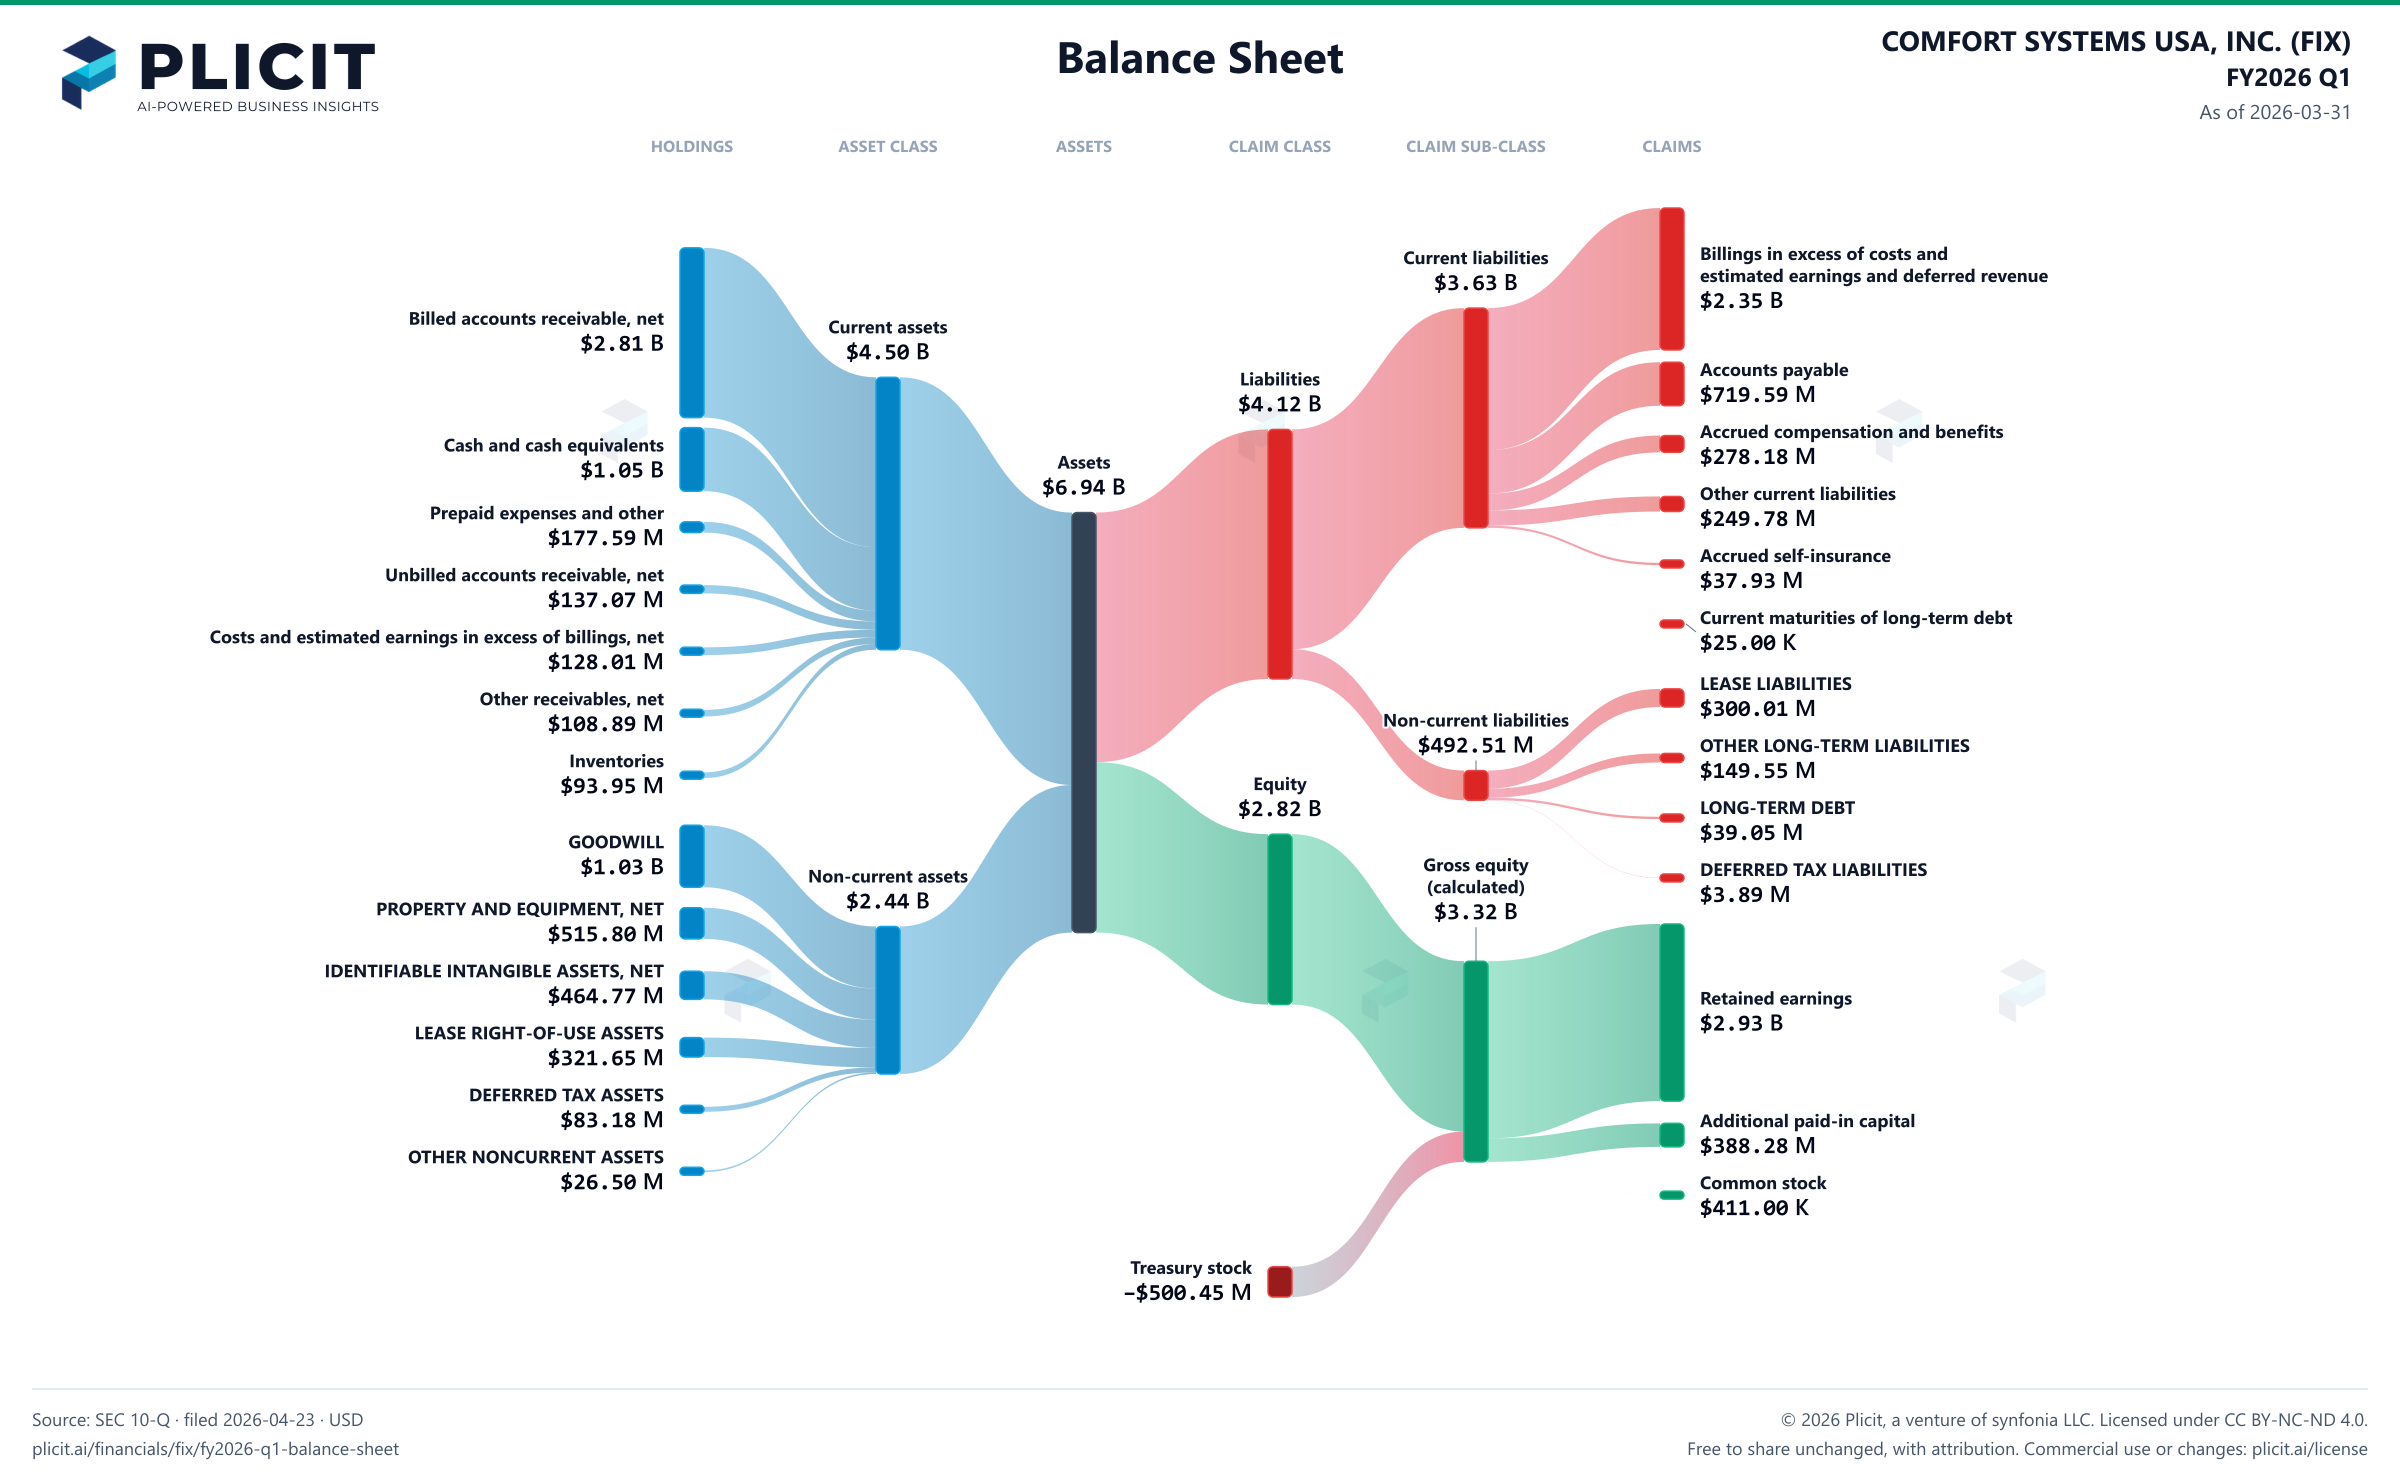
COMFORT SYSTEMS USA, INC. (FIX) FY2026 Q1 Balance Sheet Sankey chart
Free to share unchanged, with credit to Plicit.ai · CC BY-NC-ND 4.0Download PNG

Newsletter

Get the teardowns by email

Subscribe if you want the public-company teardowns in your inbox when they're released.

Product waitlist

Health Check and Teardown for your own company

A health check uncovers insights of your private books, not a public ticker. Join this list to get notified as soon as we go-live!