
First Solar, Inc. (FSLR) FY2026 Q2 Balance Sheet
As of 2026-06-30
Balance Sheet
As of 2026-06-30
Swipe to see the full flow
Chart details
First Solar, Inc. (FSLR) FY2026 Q2 Balance Sheet
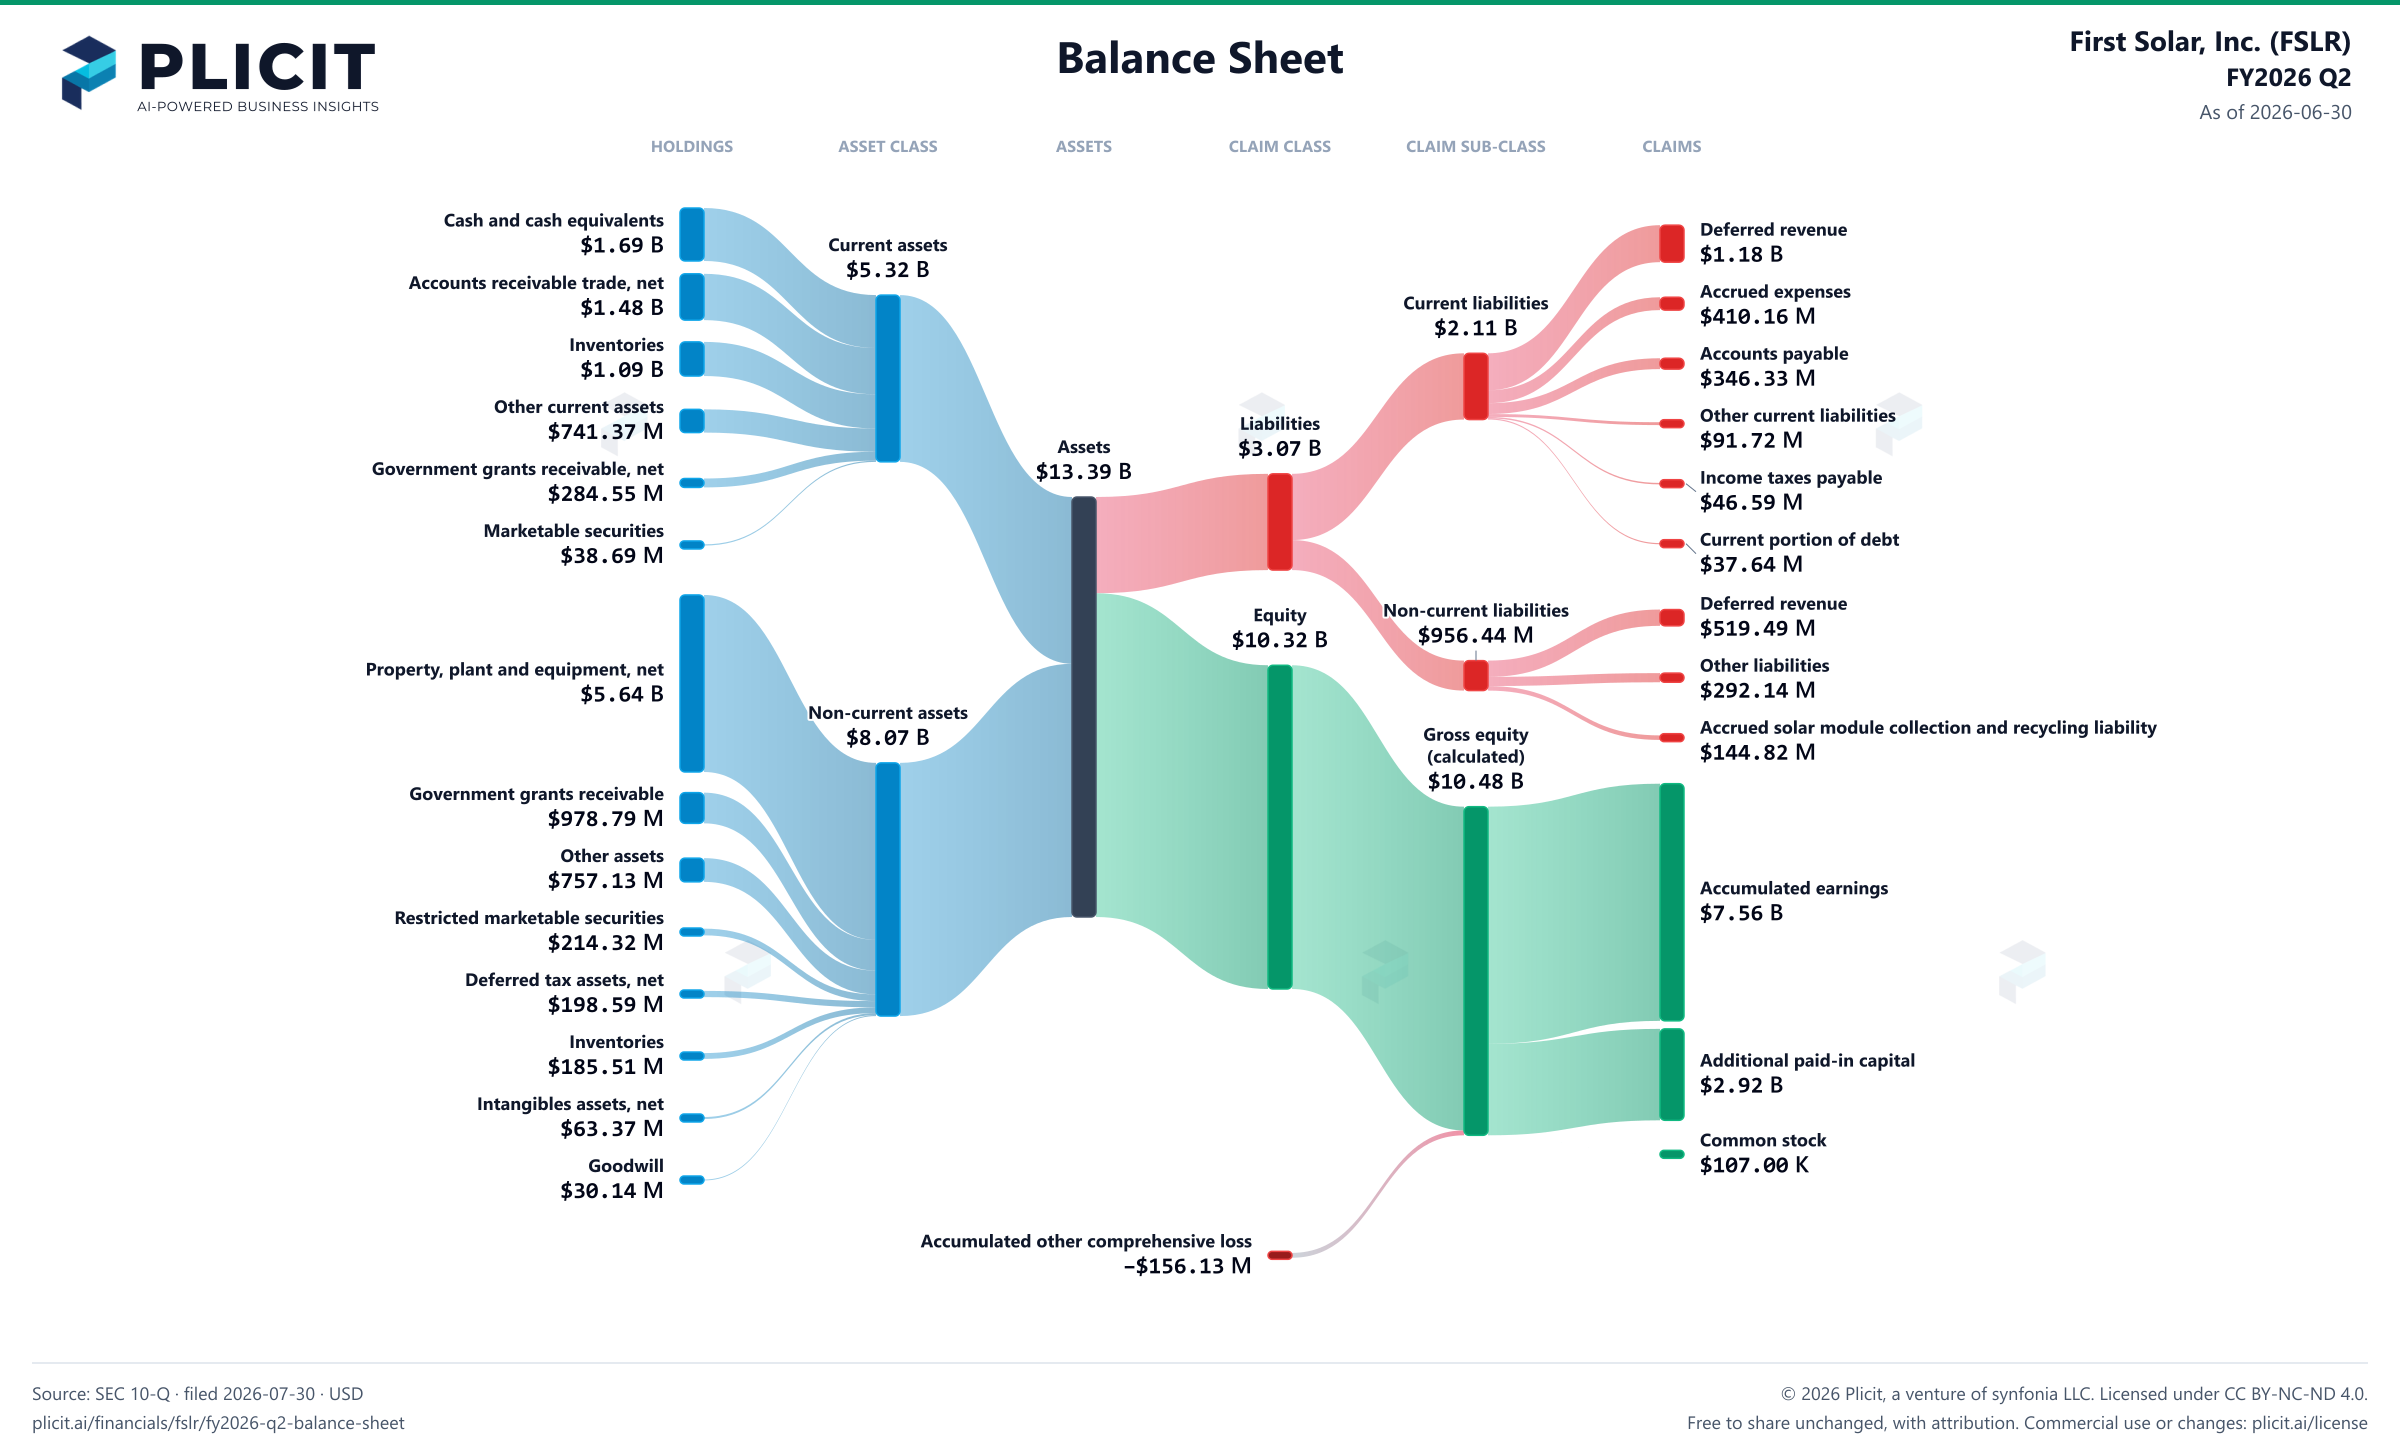
Balance sheet as of 2026-06-30. The chart shows assets, liabilities and equity at that date.
- Assets
- 13,388,598,000 US dollars
- Current assets
- 5,317,215,000 US dollars
- Non-current assets
- 8,071,383,000 US dollars
- Liabilities
- 3,068,260,000 US dollars
- Current liabilities
- 2,111,816,000 US dollars
- Non-current liabilities
- 956,444,000 US dollars
- Equity
- 10,320,338,000 US dollars
- Cash and cash equivalents
- 1,688,279,000 US dollars
- Accounts receivable trade, net
- 1,476,221,000 US dollars
- Inventories
- 1,088,115,000 US dollars
- Other current assets
- 741,366,000 US dollars
- Government grants receivable, net
- 284,549,000 US dollars
- Marketable securities
- 38,685,000 US dollars
- Property, plant and equipment, net
- 5,643,539,000 US dollars
- Government grants receivable
- 978,788,000 US dollars
- Other assets
- 757,131,000 US dollars
- Restricted marketable securities
- 214,315,000 US dollars
- Deferred tax assets, net
- 198,588,000 US dollars
- Inventories
- 185,508,000 US dollars
- Intangibles assets, net
- 63,372,000 US dollars
- Goodwill
- 30,142,000 US dollars
- Deferred revenue
- 1,179,374,000 US dollars
- Accrued expenses
- 410,164,000 US dollars
- Accounts payable
- 346,334,000 US dollars
- Other current liabilities
- 91,719,000 US dollars
- Income taxes payable
- 46,590,000 US dollars
- Current portion of debt
- 37,635,000 US dollars
- Deferred revenue
- 519,486,000 US dollars
- Other liabilities
- 292,137,000 US dollars
- Accrued solar module collection and recycling liability
- 144,821,000 US dollars
- Long-term debt
- 0 US dollars
- Accumulated earnings
- 7,560,527,000 US dollars
- Additional paid-in capital
- 2,915,837,000 US dollars
- Common stock, $0.001 par value per share; 500,000,000 shares authorized; 107,469,302 and 107,309,794 shares issued and outstanding at June 30, 2026 and December 31, 2025, respectively
- 107,000 US dollars
- Accumulated other comprehensive loss
- negative 156,133,000 US dollars
- Gross equity (calculated)
- 10,476,471,000 US dollars. Net equity plus the magnitudes of its negative contributions equals gross positive equity. The negative contributions enter this reconciliation as add-backs; their filed signs stay negative.
Chart connections
- Assets equal liabilities plus consolidated equity. Consolidated equity includes noncontrolling interests when reported.
- Treasury shares and other negative equity contributions reduce equity.
Free to share unchanged, with credit to Plicit.ai · CC BY-NC-ND 4.0Download PNG
Product waitlist
Health Check and Teardown for your own company
A health check uncovers insights of your private books, not a public ticker. Join this list to get notified as soon as we go-live!