
GCM Grosvenor Inc. (GCMG) FY2026 Q2 Balance Sheet

Balance Sheet

As of 2026-06-30

Swipe to see the full flow
GCM Grosvenor Inc. (GCMG) FY2026 Q2 Balance SheetBalance sheet as of 2026-06-30. The chart shows assets, liabilities and equity at that date.Liabilities$554.65 MAssets$677.05 MEquity$122.40 MGross equity(calculated)$140.73 MHOLDINGSASSETSCLAIM CLASSCLAIM SUB-CLASSCLAIMSInvestmentsCash and cash equivalentsDeferred tax assets, netLease right-of-use assetsPremises and equipment, netGoodwillManagement fees receivableOther assetsIncentive fees receivableDue from related parties - Related PartyDebtAccrued compensation and employee related obligationsPayable to related parties pursuant to the tax receivable agreementLease liabilitiesAccrued expenses and other liabilitiesNoncontrolling interests in GCMHAdditional paid-in capitalNoncontrolling interests in subsidiariesCommon stock - Class C common stockCommon stock - Class A common stockAssetsLiabilitiesEquityGross equity (calculated)Retained earningsAccumulated other comprehensive lossLiabilitiesLiabilities$554.65 MInvestmentsInvestments$291.64 MDebtDebt$362.00 MAssetsAssets$677.05 MCash and cash equivalentsCash and cash equivalents$139.60 MAccrued compensation and employee related obligationsAccrued compensation and employee related obligations$54.69 MPayable to related parties pursuant to the tax receivable agreementPayable to related parties pursuantto the tax receivable agreement$54.64 MDeferred tax assets, netDeferred tax assets, net$51.84 MLease right-of-use assetsLease right-of-use assets$38.23 MLease liabilitiesLease liabilities$50.94 MPremises and equipment, netPremises and equipment, net$33.61 MAccrued expenses and other liabilitiesAccrued expenses and other liabilities$32.38 MEquityEquity$122.40 MGoodwillGoodwill$28.96 MNoncontrolling interests in GCMHNoncontrolling interests in GCMH$57.63 MGross equity (calculated)Gross equity(calculated)$140.73 MManagement fees receivableManagement fees receivable$28.25 MAdditional paid-in capitalAdditional paid-in capital$43.65 MOther assetsOther assets$25.96 MNoncontrolling interests in subsidiariesNoncontrolling interests in subsidiaries$39.43 MIncentive fees receivableIncentive fees receivable$24.14 MCommon stock - Class C common stockCommon stock - Class C common stock$14.00 KDue from related parties - Related PartyDue from related parties - Related Party$14.81 MCommon stock - Class A common stockCommon stock - Class A common stock$6.00 KRetained earningsRetained earnings−$18.14 MAccumulated other comprehensive lossAccumulated other comprehensive loss−$193.00 K
Chart details

GCM Grosvenor Inc. (GCMG) FY2026 Q2 Balance Sheet

Balance sheet as of 2026-06-30. The chart shows assets, liabilities and equity at that date.

Assets
677,045,000 US dollars
Liabilities
554,648,000 US dollars
Equity
122,397,000 US dollars
Investments
291,644,000 US dollars
Cash and cash equivalents
139,596,000 US dollars
Deferred tax assets, net
51,840,000 US dollars
Lease right-of-use assets
38,230,000 US dollars
Premises and equipment, net
33,610,000 US dollars
Goodwill
28,959,000 US dollars
Management fees receivable
28,254,000 US dollars
Other assets
25,962,000 US dollars
Incentive fees receivable
24,136,000 US dollars
Due from related parties - Related Party
14,814,000 US dollars
Debt
362,003,000 US dollars
Accrued compensation and employee related obligations
54,691,000 US dollars
Payable to related parties pursuant to the tax receivable agreement
54,640,000 US dollars
Lease liabilities
50,938,000 US dollars
Accrued expenses and other liabilities
32,376,000 US dollars
Noncontrolling interests in GCMH
57,631,000 US dollars
Additional paid-in capital
43,648,000 US dollars
Noncontrolling interests in subsidiaries
39,428,000 US dollars
Common stock - Class C common stock
14,000 US dollars
Common stock - Class A common stock
6,000 US dollars
Common stock - Class B common stock
0 US dollars
Preferred stock, $0.0001 par value, 100,000,000 shares authorized, none issued
0 US dollars
Retained earnings
negative 18,137,000 US dollars
Accumulated other comprehensive loss
negative 193,000 US dollars
Gross equity (calculated)
140,727,000 US dollars. Net equity plus the magnitudes of its negative contributions equals gross positive equity. The negative contributions enter this reconciliation as add-backs; their filed signs stay negative.

Chart connections

  • Assets equal liabilities plus consolidated equity. Consolidated equity includes noncontrolling interests when reported.
  • Treasury shares and other negative equity contributions reduce equity.
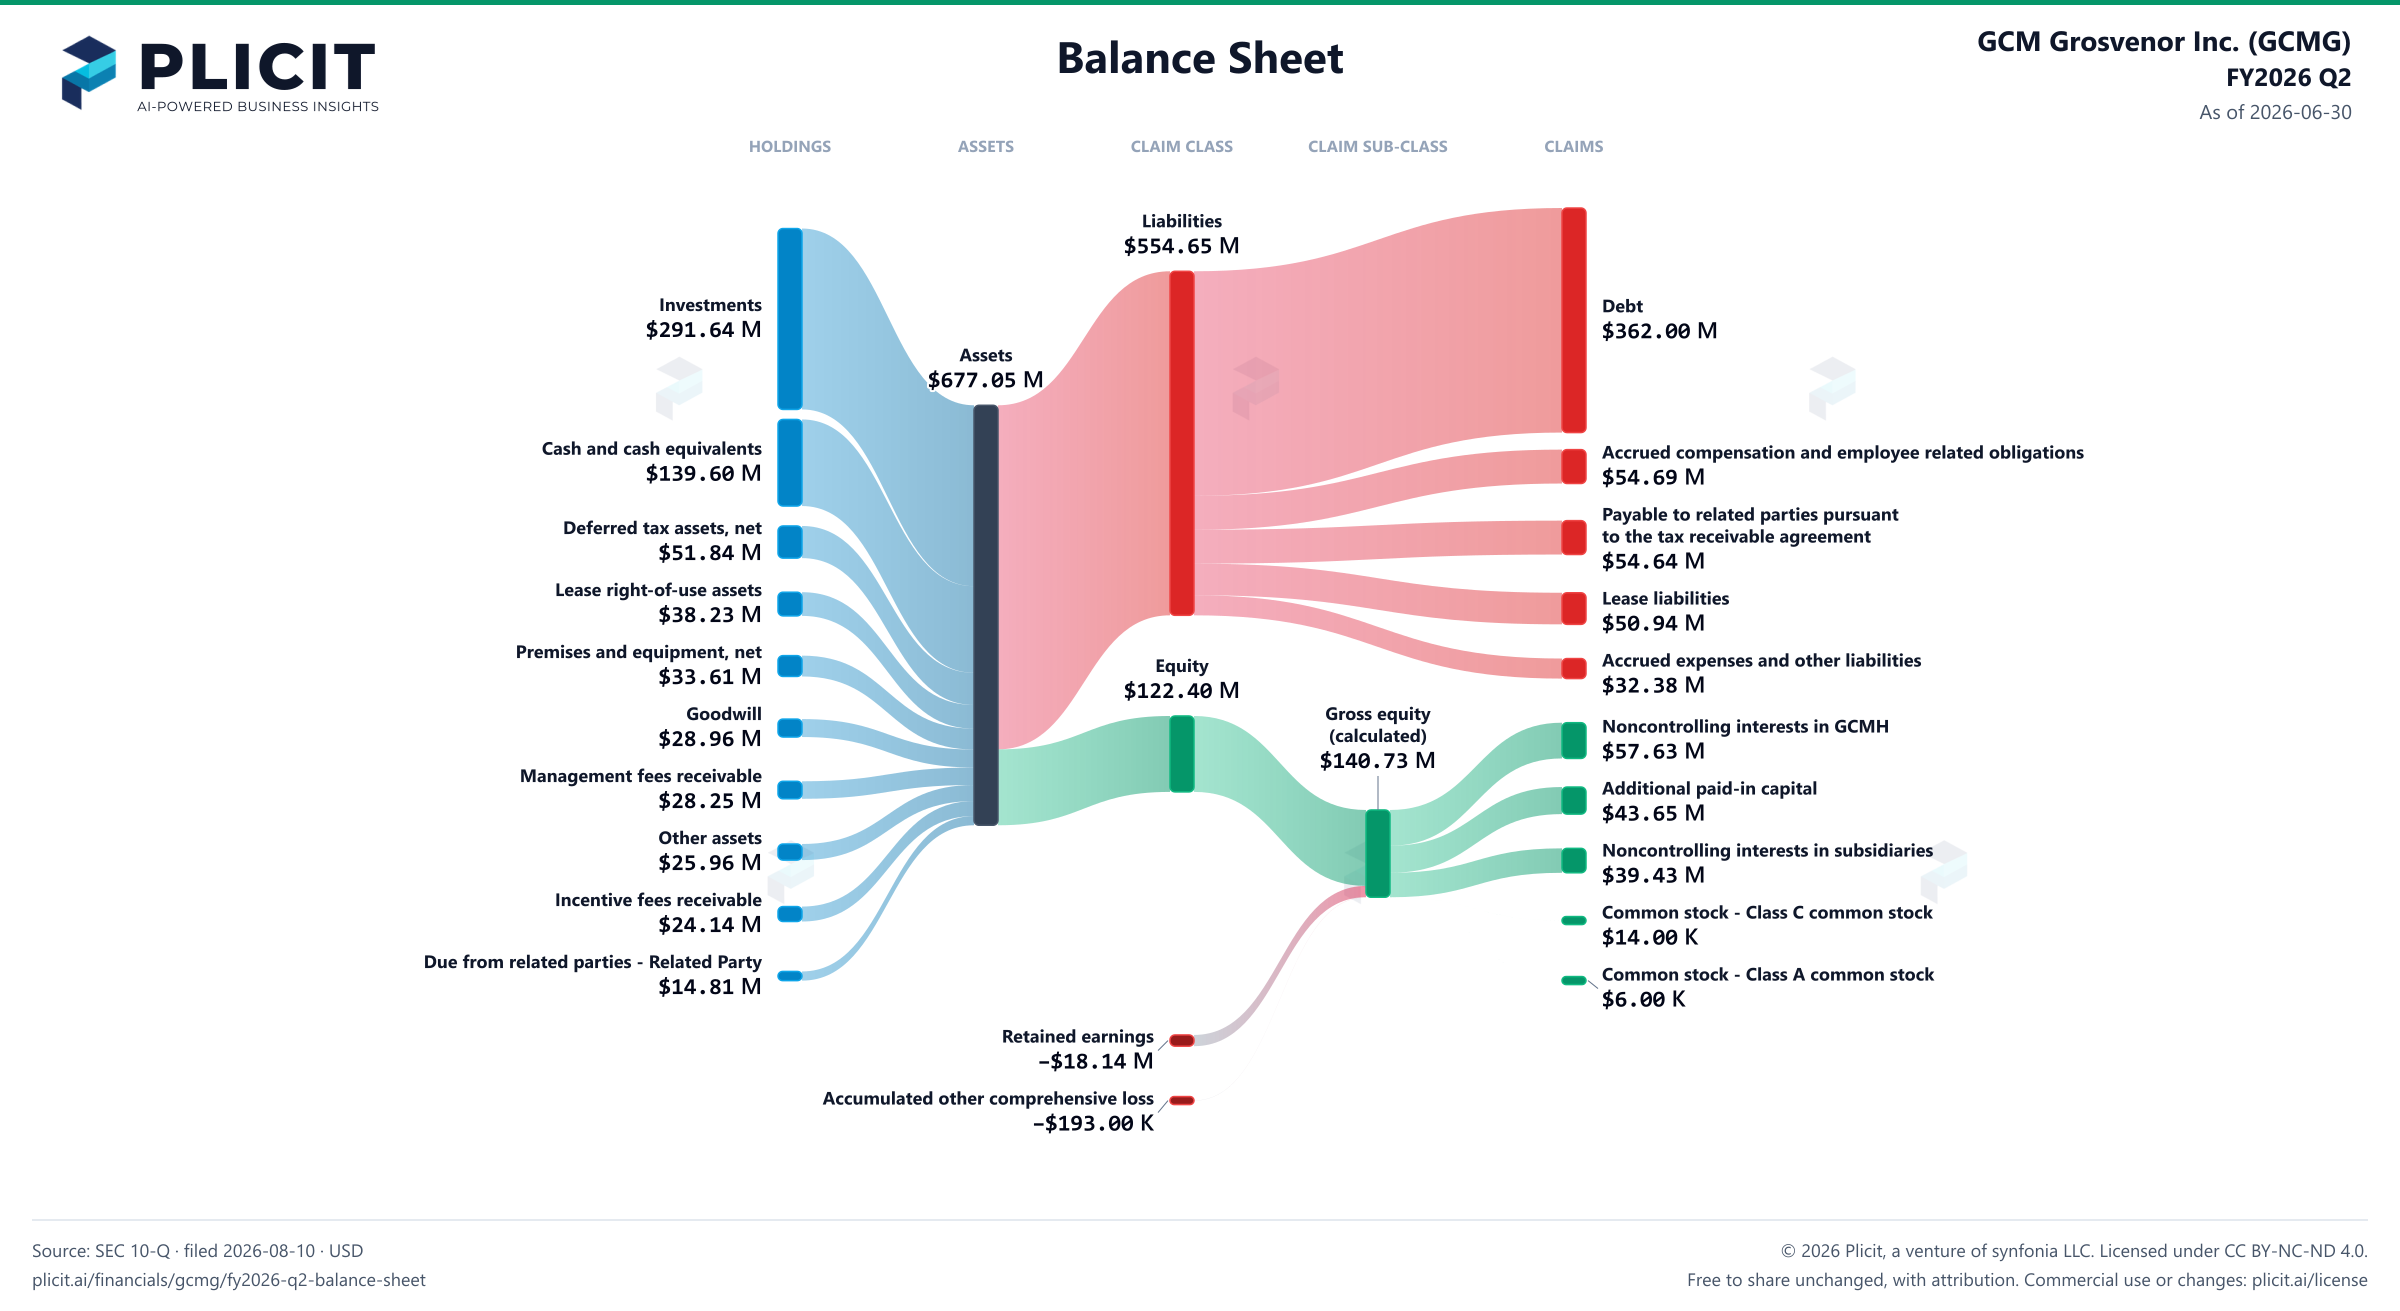
GCM Grosvenor Inc. (GCMG) FY2026 Q2 Balance Sheet Sankey chart
Free to share unchanged, with credit to Plicit.ai · CC BY-NC-ND 4.0Download PNG

Newsletter

Get the teardowns by email

Subscribe if you want the public-company teardowns in your inbox when they're released.

Product waitlist

Health Check and Teardown for your own company

A health check uncovers insights of your private books, not a public ticker. Join this list to get notified as soon as we go-live!