
GENERAL MOTORS COMPANY (GM) FY2026 Q3 Balance Sheet

Balance Sheet

As of 2026-09-30

Swipe to see the full flow
GENERAL MOTORS COMPANY (GM) FY2026 Q3 Balance SheetBalance sheet as of 2026-09-30. The chart shows assets, liabilities and equity at that date.Current liabilities$106.33 BLiabilities$224.66 BCurrent assets$115.87 BAssets$289.18 BNon-current liabilities$118.33 BNon-current assets$173.32 BEquity$64.52 BHOLDINGSASSET CLASSASSETSCLAIM CLASSCLAIM SUB-CLASSCLAIMSGM Financial receivables, net of allowance of $1,191 and $1,168 (Note 4; Note 8) - GM FinancialCash and cash equivalents (Note 3)Accounts and notes receivable, net of allowance of $234 and $244Inventories (Note 5)Other current assets (Note 3; Note 8)Marketable debt securities (Note 3)Property, netGM Financial receivables, net of allowance of $1,704 and $1,557 (Note 4; Note 8) - GM FinancialEquipment on operating leases, net (Note 6; Note 8)Deferred income taxesOther assets (Note 3; Note 8)Equity in net assets of nonconsolidated affiliates (Note 7)Goodwill and intangible assets, netShort-term debt and current portion of long-term debt (Note 9) - GM FinancialAccrued liabilitiesAccounts payable (principally trade)Short-term debt and current portion of long-term debt (Note 9) - AutomotiveLong-term debt (Note 9) - GM FinancialOther liabilitiesLong-term debt (Note 9) - AutomotivePensions (Note 12)Postretirement benefits other than pensions (Note 12)Retained earningsAdditional paid-in capitalCommon stock, $0.01 par valueNoncontrolling interestsAccumulated other comprehensive lossCurrent assetsNon-current assetsAssetsCurrent liabilitiesNon-current liabilitiesLiabilitiesEquityCurrent liabilitiesCurrent liabilities$106.33 BShort-term debt and current portion of long-term debt (Note 9) - GM FinancialShort-term debt and current portion oflong-term debt (Note 9) - GM Financial$42.94 BGM Financial receivables, net of allowance of $1,191 and $1,168 (Note 4; Note 8) - GM FinancialGM Financial receivables, net of allowance of$1,191 and $1,168 (Note 4; Note 8) - GM Financial$46.45 BAccrued liabilitiesAccrued liabilities$33.10 BLiabilitiesLiabilities$224.66 BCurrent assetsCurrent assets$115.87 BAccounts payable (principally trade)Accounts payable (principally trade)$29.76 BCash and cash equivalents (Note 3)Cash and cash equivalents (Note 3)$23.20 BShort-term debt and current portion of long-term debt (Note 9) - AutomotiveShort-term debt and current portion oflong-term debt (Note 9) - Automotive$529.00 MAccounts and notes receivable, net of allowance of $234 and $244Accounts and notes receivable, net$17.14 BAssetsAssets$289.18 BInventories (Note 5)Inventories (Note 5)$15.64 BLong-term debt (Note 9) - GM FinancialLong-term debt (Note 9) - GM Financial$70.01 BNon-current liabilitiesNon-current liabilities$118.33 BOther current assets (Note 3; Note 8)Other current assets (Note 3; Note 8)$8.83 BMarketable debt securities (Note 3)Marketable debt securities (Note 3)$4.61 BOther liabilitiesOther liabilities$24.66 BLong-term debt (Note 9) - AutomotiveLong-term debt (Note 9) - Automotive$15.27 BProperty, netProperty, net$54.80 BNon-current assetsNon-current assets$173.32 BPensions (Note 12)Pensions (Note 12)$4.50 BGM Financial receivables, net of allowance of $1,704 and $1,557 (Note 4; Note 8) - GM FinancialGM Financial receivables, net of allowance of$1,704 and $1,557 (Note 4; Note 8) - GM Financial$44.98 BPostretirement benefits other than pensions (Note 12)Postretirement benefits other than pensions (Note 12)$3.91 BEquipment on operating leases, net (Note 6; Note 8)Equipment on operating leases, net (Note 6; Note 8)$32.24 BRetained earningsRetained earnings$54.21 BDeferred income taxesDeferred income taxes$22.15 BEquityEquity$64.52 BOther assets (Note 3; Note 8)Other assets (Note 3; Note 8)$9.50 BAdditional paid-in capitalAdditional paid-in capital$18.75 BEquity in net assets of nonconsolidated affiliates (Note 7)Equity in net assets of nonconsolidated affiliates$5.38 BCommon stock, $0.01 par valueCommon stock, $0.01 par value$8.00 MGoodwill and intangible assets, netGoodwill and intangible assets, net$4.28 BNoncontrolling interestsNoncontrolling interests$1.71 BAccumulated other comprehensive lossAccumulated other comprehensive loss−$10.16 B
Chart details

GENERAL MOTORS COMPANY (GM) FY2026 Q3 Balance Sheet

Balance sheet as of 2026-09-30. The chart shows assets, liabilities and equity at that date.

Assets
289,183,000,000 US dollars
Current assets
115,867,000,000 US dollars
Non-current assets
173,316,000,000 US dollars
Liabilities
224,664,000,000 US dollars
Current liabilities
106,330,000,000 US dollars
Non-current liabilities
118,334,000,000 US dollars
Equity
64,518,000,000 US dollars
Noncontrolling interest
1,712,000,000 US dollars. Included in consolidated equity; this amount is not added again.
GM Financial receivables, net of allowance of $1,191 and $1,168 (Note 4; Note 8) - GM Financial
46,453,000,000 US dollars
Cash and cash equivalents (Note 3)
23,196,000,000 US dollars
Accounts and notes receivable, net of allowance of $234 and $244
17,138,000,000 US dollars
Inventories (Note 5)
15,640,000,000 US dollars
Other current assets (Note 3; Note 8)
8,831,000,000 US dollars
Marketable debt securities (Note 3)
4,609,000,000 US dollars
Property, net
54,798,000,000 US dollars
GM Financial receivables, net of allowance of $1,704 and $1,557 (Note 4; Note 8) - GM Financial
44,979,000,000 US dollars
Equipment on operating leases, net (Note 6; Note 8)
32,244,000,000 US dollars
Deferred income taxes
22,145,000,000 US dollars
Other assets (Note 3; Note 8)
9,495,000,000 US dollars
Equity in net assets of nonconsolidated affiliates (Note 7)
5,379,000,000 US dollars
Goodwill and intangible assets, net
4,276,000,000 US dollars
Short-term debt and current portion of long-term debt (Note 9) - GM Financial
42,939,000,000 US dollars
Accrued liabilities
33,097,000,000 US dollars
Accounts payable (principally trade)
29,764,000,000 US dollars
Short-term debt and current portion of long-term debt (Note 9) - Automotive
529,000,000 US dollars
Long-term debt (Note 9) - GM Financial
70,005,000,000 US dollars
Other liabilities
24,659,000,000 US dollars
Long-term debt (Note 9) - Automotive
15,270,000,000 US dollars
Pensions (Note 12)
4,496,000,000 US dollars
Postretirement benefits other than pensions (Note 12)
3,905,000,000 US dollars
Retained earnings
54,210,000,000 US dollars
Additional paid-in capital
18,749,000,000 US dollars
Common stock, $0.01 par value
8,000,000 US dollars
Noncontrolling interests
1,712,000,000 US dollars
Accumulated other comprehensive loss
negative 10,162,000,000 US dollars

Chart connections

  • Assets equal liabilities plus consolidated equity. Consolidated equity includes noncontrolling interests when reported.
  • Treasury shares and other negative equity contributions reduce equity.
  • Total assets are $289,183.00 M and liabilities and equity are $289,182.00 M; the $1.00 M difference is within the rounding of the filed amounts.
  • The filed current liabilities lines add up to $106,329.00 M and the current liabilities total is $106,330.00 M; the $1.00 M difference is within the rounding of the filed amounts.
  • The filed non-current liabilities lines add up to $118,335.00 M and the non-current liabilities total is $118,334.00 M; the $1.00 M difference is within the rounding of the filed amounts.
  • The filed equity lines add up to $64,517.00 M and the equity total is $64,518.00 M; the $1.00 M difference is within the rounding of the filed amounts.
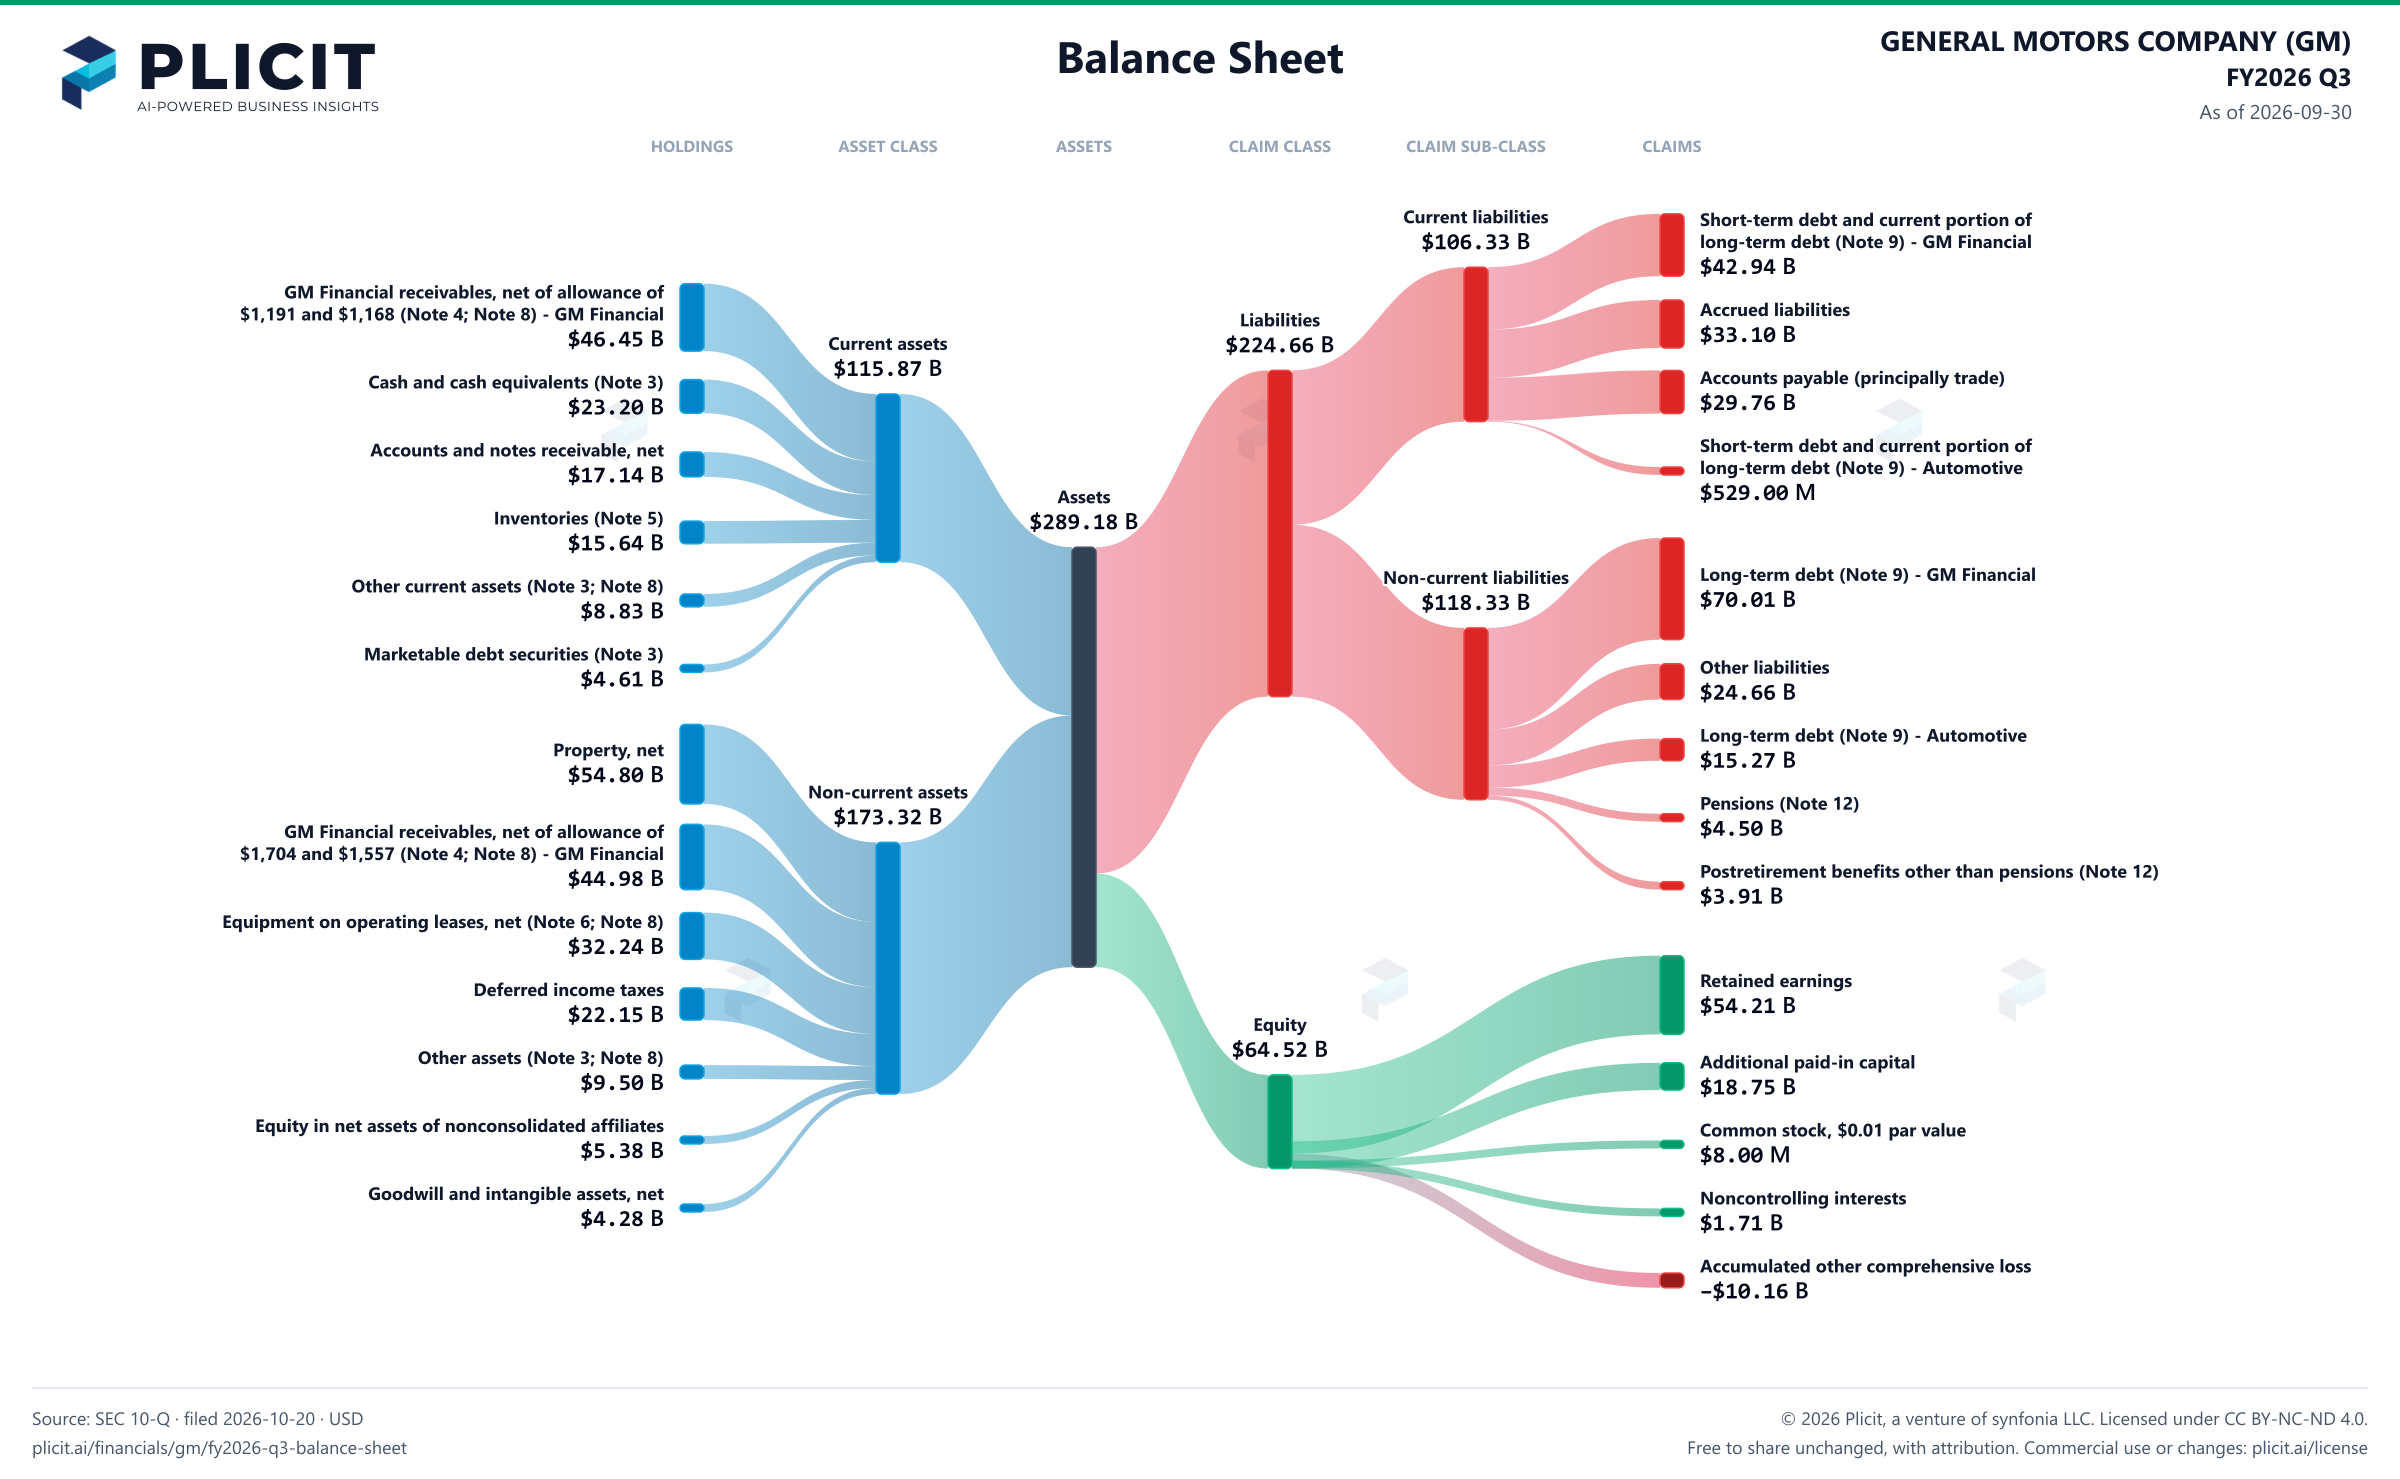
GENERAL MOTORS COMPANY (GM) FY2026 Q3 Balance Sheet Sankey chart
Free to share unchanged, with credit to Plicit.ai · CC BY-NC-ND 4.0Download PNG

Newsletter

Get the teardowns by email

Subscribe if you want the public-company teardowns in your inbox when they're released.

Product waitlist

Health Check and Teardown for your own company

A health check uncovers insights of your private books, not a public ticker. Join this list to get notified as soon as we go-live!