
GENTEX CORPORATION (GNTX) FY2026 Q2 P&L / Income Statement
2026-04-01 to 2026-06-30
Revenue by Product and Service
2026-04-01 to 2026-06-30
Swipe to see the full flow
Chart details
GENTEX CORPORATION (GNTX) FY2026 Q2 P&L / Income Statement
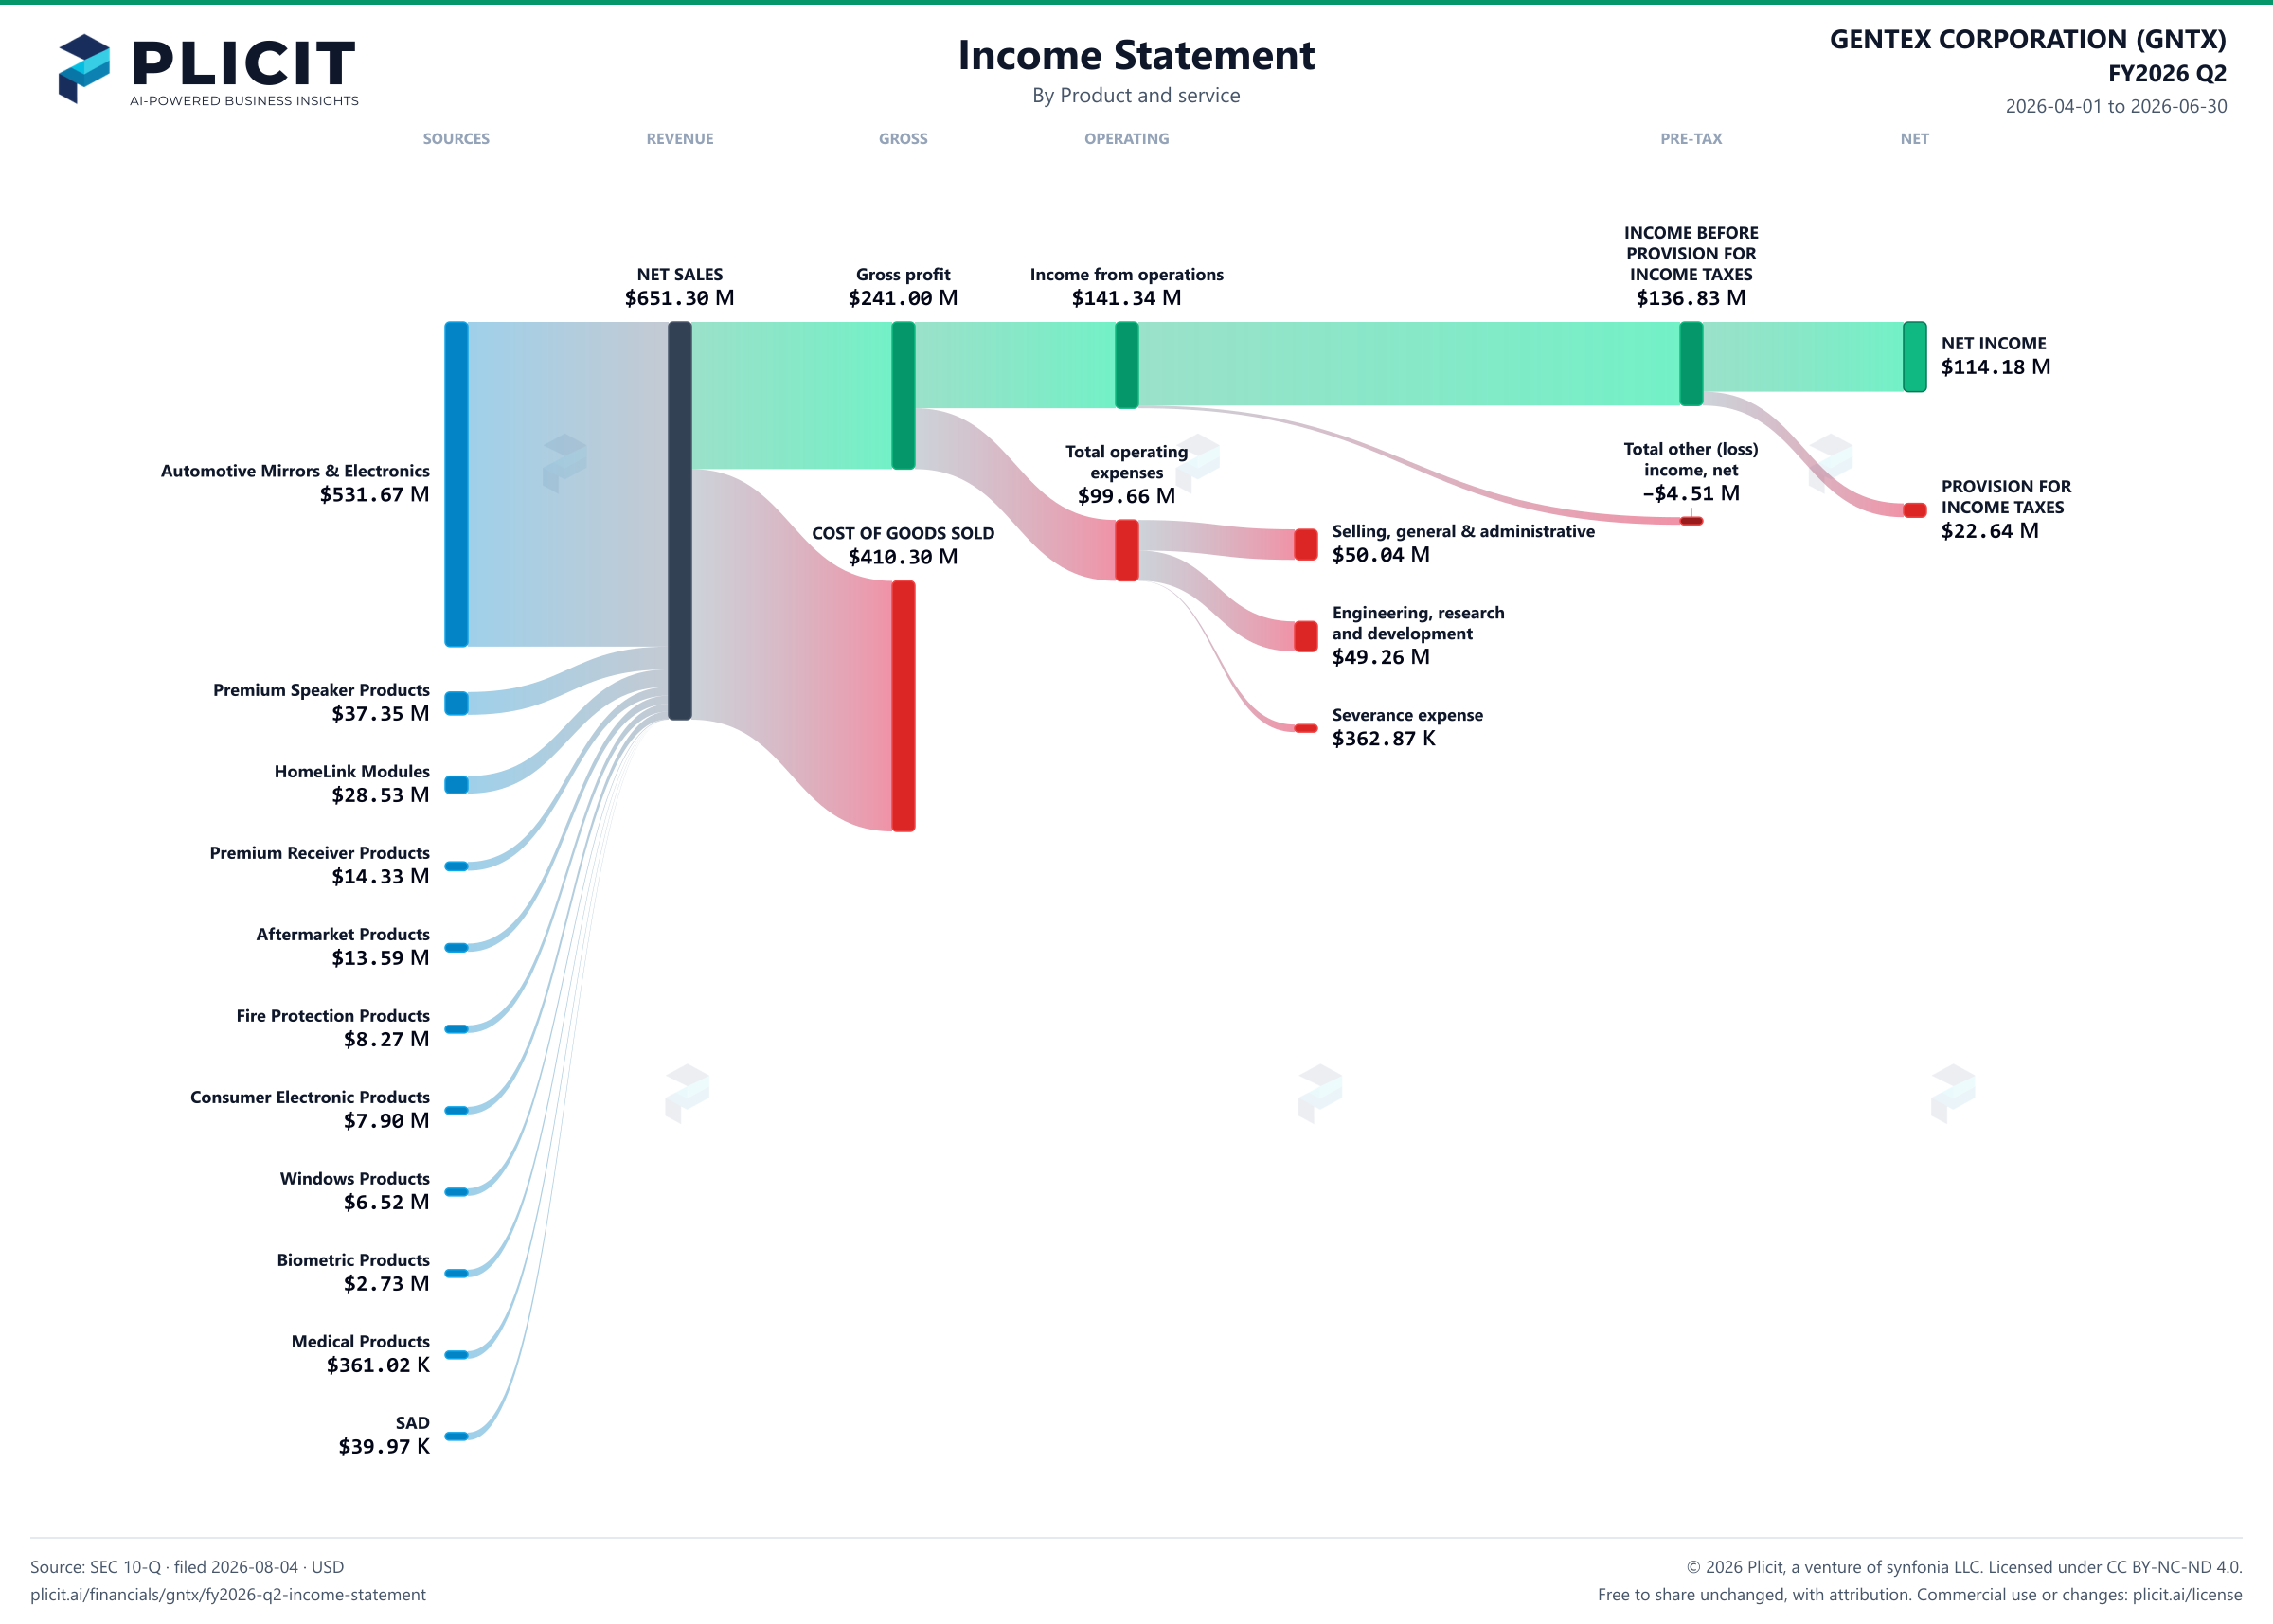
Income statement for 2026-04-01 through 2026-06-30. View: Product and service. Revenue uses this breakdown; costs and expenses retain the consolidated categories.
- NET SALES
- 651,299,705 US dollars
- COST OF GOODS SOLD
- 410,301,978 US dollars
- Gross profit
- 240,997,727 US dollars
- Total operating expenses
- 99,659,333 US dollars
- Income from operations
- 141,338,394 US dollars
- Total other (loss) income, net
- negative 4,509,704 US dollars
- INCOME BEFORE PROVISION FOR INCOME TAXES
- 136,828,690 US dollars
- PROVISION FOR INCOME TAXES
- 22,644,919 US dollars
- NET INCOME
- 114,183,771 US dollars
- Automotive Mirrors & Electronics
- 531,669,550 US dollars
- HomeLink Modules
- 28,531,865 US dollars
- Fire Protection Products
- 8,272,590 US dollars
- Windows Products
- 6,520,379 US dollars
- Medical Products
- 361,016 US dollars
- Aftermarket Products
- 13,586,193 US dollars
- Consumer Electronic Products
- 7,903,080 US dollars
- Small Area Device
- 39,973 US dollars
- Biometric Products
- 2,727,652 US dollars
- Premium Speaker Products
- 37,352,998 US dollars
- Premium Receiver Products
- 14,334,409 US dollars
- Engineering, research and development
- 49,259,001 US dollars
- Selling, general & administrative
- 50,037,461 US dollars
- Severance expense
- 362,871 US dollars
- Impairment charges (Note 3)
- 0 US dollars
Chart connections
- Revenue less cost of revenue equals gross profit; gross profit less operating expenses equals operating income.
- Operating income plus other income or expense equals income before tax. Income before tax less income tax expense or benefit equals net income.
- Of which attributable to GENTEX CORPORATION: $114.69 M; to noncontrolling interests: −$505.65 K.
Free to share unchanged, with credit to Plicit.ai · CC BY-NC-ND 4.0Download PNG
Gross margin
37.0%
Gross profit / revenue
Operating margin
21.7%
Operating profit / revenue
Cash conversion
161.7%
Operating cash / net income, same period
Product waitlist
Health Check and Teardown for your own company
A health check uncovers insights of your private books, not a public ticker. Join this list to get notified as soon as we go-live!