
GENTEX CORPORATION (GNTX) FY2026 YTD Q2 P&L / Income Statement
2026-01-01 to 2026-06-30
Revenue by Product and Service
2026-01-01 to 2026-06-30
Swipe to see the full flow
Chart details
GENTEX CORPORATION (GNTX) FY2026 YTD Q2 P&L / Income Statement
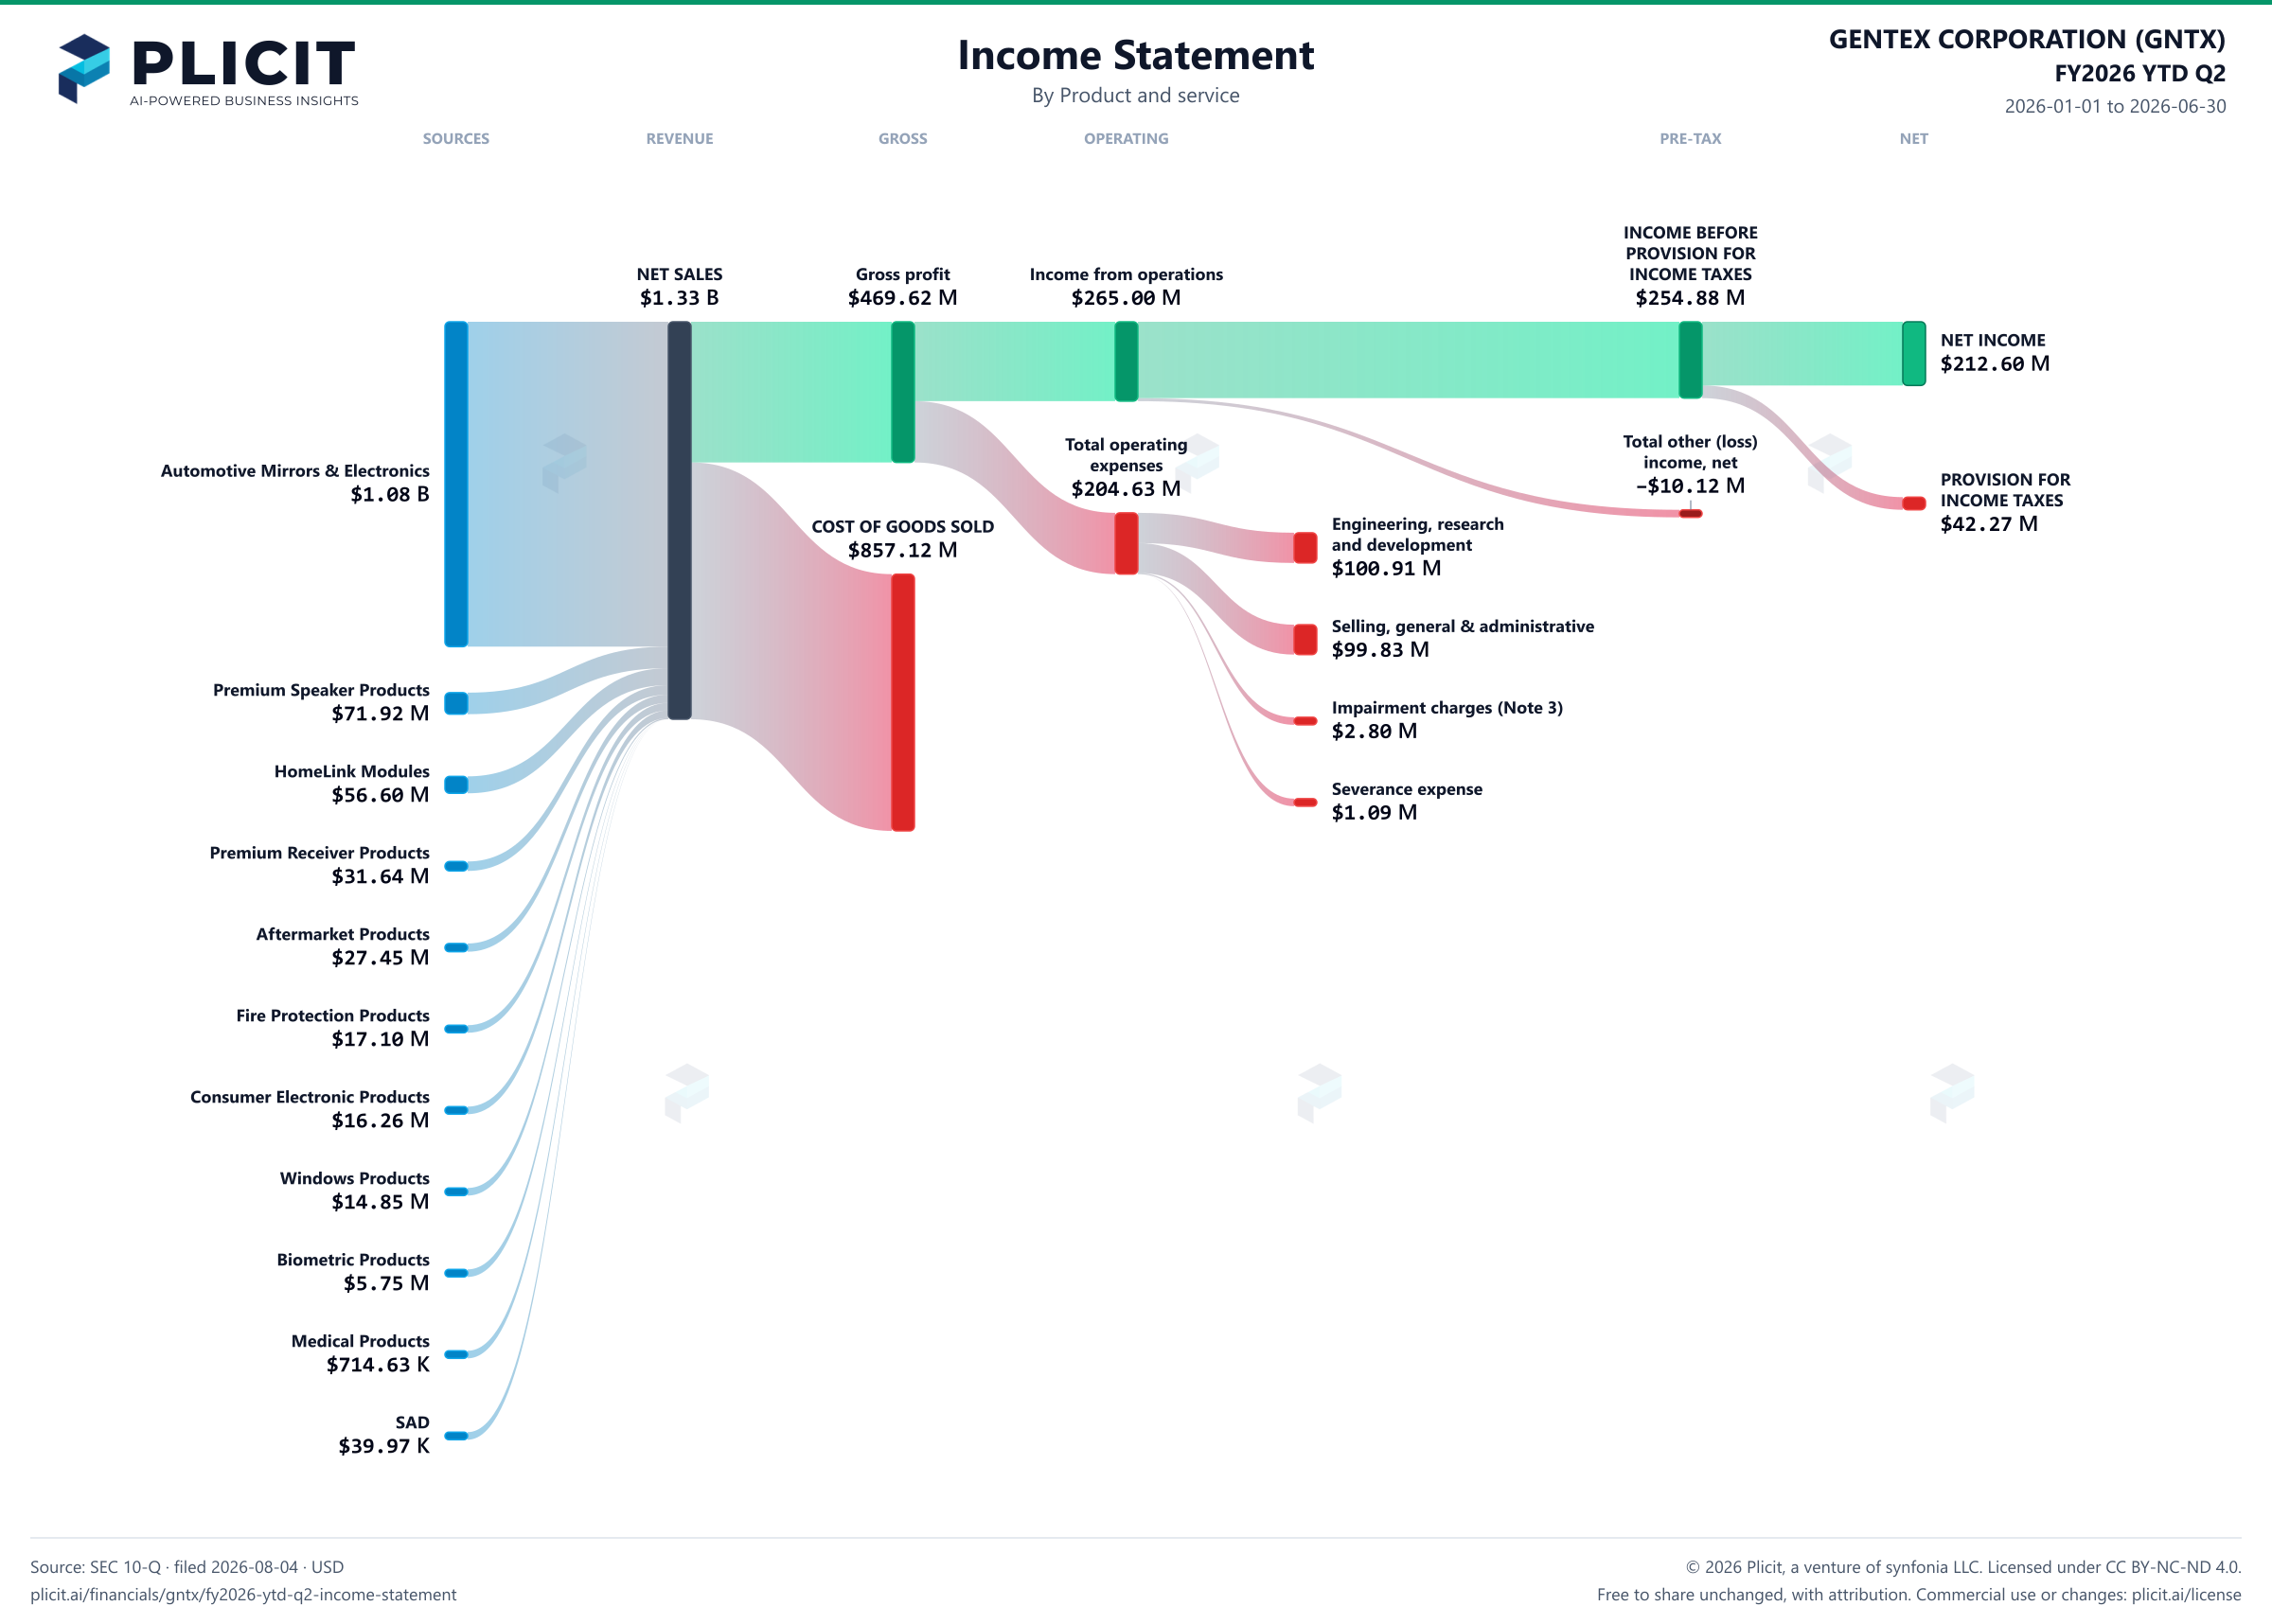
Income statement for 2026-01-01 through 2026-06-30. View: Product and service. Revenue uses this breakdown; costs and expenses retain the consolidated categories.
- NET SALES
- 1,326,742,831 US dollars
- COST OF GOODS SOLD
- 857,118,190 US dollars
- Gross profit
- 469,624,641 US dollars
- Total operating expenses
- 204,626,328 US dollars
- Income from operations
- 264,998,313 US dollars
- Total other (loss) income, net
- negative 10,122,061 US dollars
- INCOME BEFORE PROVISION FOR INCOME TAXES
- 254,876,252 US dollars
- PROVISION FOR INCOME TAXES
- 42,271,422 US dollars
- NET INCOME
- 212,604,830 US dollars
- Automotive Mirrors & Electronics
- 1,084,407,570 US dollars
- HomeLink Modules
- 56,599,757 US dollars
- Fire Protection Products
- 17,099,759 US dollars
- Windows Products
- 14,854,779 US dollars
- Medical Products
- 714,631 US dollars
- Aftermarket Products
- 27,454,322 US dollars
- Consumer Electronic Products
- 16,264,843 US dollars
- Small Area Device
- 39,973 US dollars
- Biometric Products
- 5,748,829 US dollars
- Premium Speaker Products
- 71,918,245 US dollars
- Premium Receiver Products
- 31,640,123 US dollars
- Engineering, research and development
- 100,911,620 US dollars
- Selling, general & administrative
- 99,829,295 US dollars
- Severance expense
- 1,085,413 US dollars
- Impairment charges (Note 3)
- 2,800,000 US dollars
Chart connections
- Revenue less cost of revenue equals gross profit; gross profit less operating expenses equals operating income.
- Operating income plus other income or expense equals income before tax. Income before tax less income tax expense or benefit equals net income.
- Of which attributable to GENTEX CORPORATION: $213.14 M; to noncontrolling interests: −$539.73 K.
Free to share unchanged, with credit to Plicit.ai · CC BY-NC-ND 4.0Download PNG
Gross margin
35.4%
Gross profit / revenue
Operating margin
20.0%
Operating profit / revenue
Cash conversion
151.3%
Operating cash / net income, same period
Product waitlist
Health Check and Teardown for your own company
A health check uncovers insights of your private books, not a public ticker. Join this list to get notified as soon as we go-live!