
Group 1 Automotive, Inc (GPI) FY2026 Q2 Balance Sheet
As of 2026-06-30
Balance Sheet
As of 2026-06-30
Swipe to see the full flow
Chart details
Group 1 Automotive, Inc (GPI) FY2026 Q2 Balance Sheet
Balance sheet as of 2026-06-30. The chart shows assets, liabilities and equity at that date.
- Assets
- 10,286,500,000 US dollars
- Current assets
- 3,672,900,000 US dollars
- Non-current assets
- 6,613,600,000 US dollars
- Liabilities (calculated)
- 7,334,300,000 US dollars
- Current liabilities
- 3,601,500,000 US dollars
- Non-current liabilities
- 3,732,800,000 US dollars
- Equity
- 2,952,200,000 US dollars
- Inventories
- 2,759,600,000 US dollars
- Contracts-in-transit and vehicle receivables, net
- 299,700,000 US dollars
- Accounts and notes receivable, net
- 287,000,000 US dollars
- Cash and cash equivalents
- 164,500,000 US dollars
- Current assets classified as held for sale
- 107,200,000 US dollars
- Prepaid expenses
- 37,900,000 US dollars
- Other current assets
- 17,000,000 US dollars
- Property and equipment, net of accumulated depreciation of $787.2 and $746.3, respectively
- 3,101,700,000 US dollars
- Goodwill
- 2,172,600,000 US dollars
- Intangible franchise rights
- 947,400,000 US dollars
- Operating lease assets
- 255,800,000 US dollars
- Other long-term assets
- 136,100,000 US dollars
- Floorplan notes payable — credit facility and other, net of offset account of $157.5 and $504.2, respectively
- 1,404,300,000 US dollars
- Floorplan notes payable — manufacturer affiliates
- 776,900,000 US dollars
- Accounts payable
- 685,600,000 US dollars
- Accrued expenses and other current liabilities
- 394,700,000 US dollars
- Current maturities of long-term debt
- 314,600,000 US dollars
- Current operating lease liabilities
- 25,300,000 US dollars
- Current liabilities classified as held for sale
- 0 US dollars
- Long-term debt
- 3,048,400,000 US dollars
- Deferred income taxes
- 325,900,000 US dollars
- Long-term operating lease liabilities
- 207,000,000 US dollars
- Other long-term liabilities
- 151,500,000 US dollars
- Retained earnings
- 4,642,300,000 US dollars
- Additional paid-in capital
- 401,500,000 US dollars
- Accumulated other comprehensive income (loss)
- 20,900,000 US dollars
- Common stock, $0.01 par value, 50,000,000 shares authorized; 24,922,415 and 24,941,249 shares issued, respectively
- 200,000 US dollars
- Treasury stock, at cost; 12,996,502 and 12,897,840 shares, respectively
- negative 2,112,800,000 US dollars
Chart connections
- Assets equal liabilities plus consolidated equity. Consolidated equity includes noncontrolling interests when reported.
- Treasury shares and other negative equity contributions reduce equity.
- The filed current liabilities lines add up to $3,601.40 M and the current liabilities total is $3,601.50 M; the $0.10 M difference is within the rounding of the filed amounts.
- The filed equity lines add up to $2,952.10 M and the equity total is $2,952.20 M; the $0.10 M difference is within the rounding of the filed amounts.
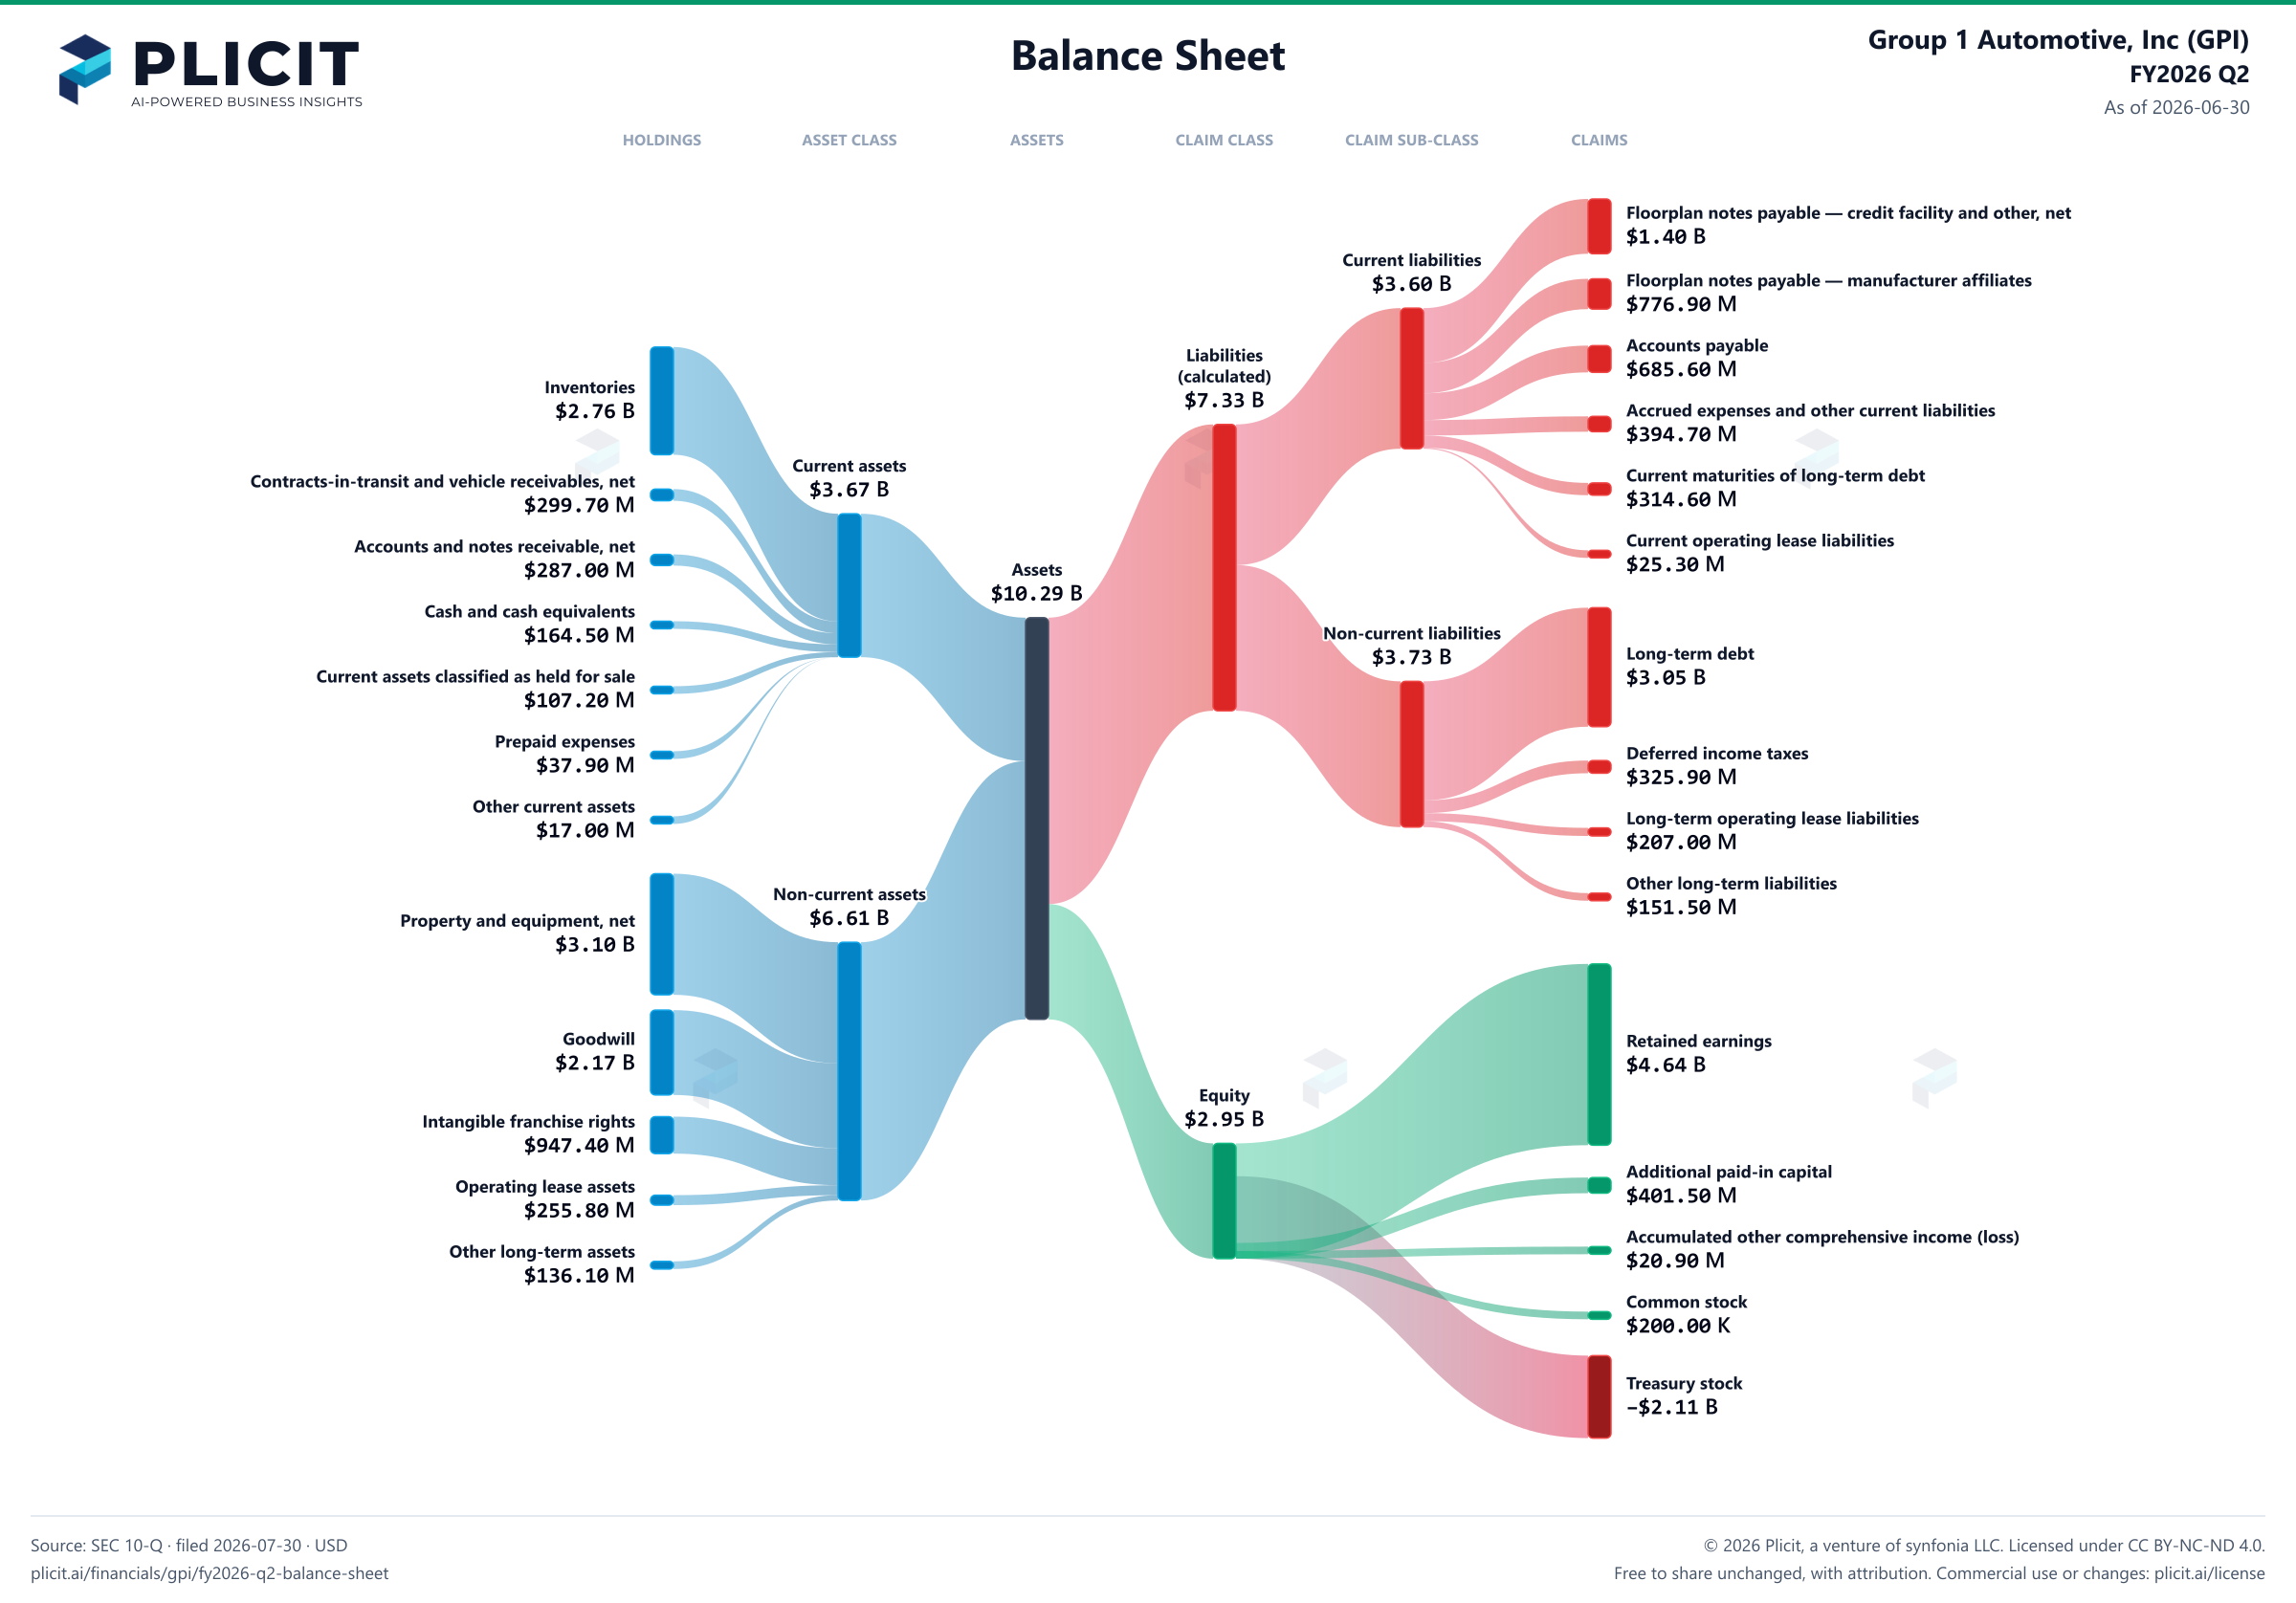
Free to share unchanged, with credit to Plicit.ai · CC BY-NC-ND 4.0Download PNG
Product waitlist
Health Check and Teardown for your own company
A health check uncovers insights of your private books, not a public ticker. Join this list to get notified as soon as we go-live!