
GREEN PLAINS INC. (GPRE) FY2026 Q2 Balance Sheet

Published Source: Form 10-Q on SEC EDGAR filed (opens in a new tab)

As of 2026-06-30

Balance Sheet

Swipe to see the full flow
GREEN PLAINS INC. (GPRE) FY2026 Q2 Balance SheetBalance sheet as of 2026-06-30. The chart shows assets, liabilities and equity at that date.Current liabilities$313.75 MLiabilities$787.22 MCurrent assets$625.45 MAssets$1.66 BNon-current liabilities$473.48 MEquity$869.85 MNon-current assets$1.03 BHOLDINGSASSET CLASSASSETSCLAIM CLASSCLAIM SUB-CLASSCLAIMSCash and cash equivalentsProduction tax creditsInventoriesAccounts receivable, net of allowances of $772 and $801, respectivelyRestricted cashDerivative financial instrumentsPrepaid expenses and otherProperty and equipment, net of accumulated depreciation ‎and amortization of $703,871 and $681,713, respectivelyOperating lease right-of-use assetsOther assetsAccounts payableCurrent maturities of long-term debtAccrued and other liabilitiesUnearned revenueShort-term notes payable and other borrowingsDerivative financial instrumentsOperating lease current liabilitiesLong-term debtOperating lease long-term liabilitiesOther liabilitiesCarbon equipment liabilitiesAdditional paid-in capitalAccumulated other comprehensive income (loss)Common stock, $0.001 par value; 150,000,000 shares authorized; ‎75,765,934 and 75,495,731 shares issued, and 70,098,280 ‎and 69,828,077 shares outstanding, respectivelyRetained deficitTreasury stock, 5,667,654 sharesNoncontrolling interestsCurrent assetsNon-current assetsAssetsCurrent liabilitiesNon-current liabilitiesLiabilitiesEquityEquityAccounts payableAccounts payable$94.69 MCurrent maturities of long-term debtCurrent maturities of long-term debt$69.51 MCurrent liabilitiesCurrent liabilities$313.75 MAccrued and other liabilitiesAccrued and other liabilities$42.53 MCash and cash equivalentsCash and cash equivalents$185.38 MUnearned revenueUnearned revenue$29.90 MProduction tax creditsProduction tax credits$133.18 MShort-term notes payable and other borrowingsShort-term notes payable and other borrowings$27.00 MLiabilitiesLiabilities$787.22 MCurrent assetsCurrent assets$625.45 MInventoriesInventories$128.56 MDerivative financial instrumentsDerivative financial instruments$26.61 MOperating lease current liabilitiesOperating lease current liabilities$23.51 MAccounts receivable, net of allowances of $772 and $801, respectivelyAccounts receivable, net$79.58 MAssetsAssets$1.66 BRestricted cashRestricted cash$57.69 MLong-term debtLong-term debt$387.18 MNon-current liabilitiesNon-current liabilities$473.48 MDerivative financial instrumentsDerivative financial instruments$24.00 MOperating lease long-term liabilitiesOperating lease long-term liabilities$41.44 MPrepaid expenses and otherPrepaid expenses and other$17.05 MOther liabilitiesOther liabilities$32.50 MCarbon equipment liabilitiesCarbon equipment liabilities$12.36 MEquityEquity$869.85 MNon-current assetsNon-current assets$1.03 BProperty and equipment, net of accumulated depreciation ‎and amortization of $703,871 and $681,713, respectivelyProperty and equipment, net$918.05 MAdditional paid-in capitalAdditional paid-in capital$1.27 BAccumulated other comprehensive income (loss)Accumulated other comprehensive income (loss)$2.01 MOperating lease right-of-use assetsOperating lease right-of-use assets$63.80 MCommon stock, $0.001 par value; 150,000,000 shares authorized; ‎75,765,934 and 75,495,731 shares issued, and 70,098,280 ‎and 69,828,077 shares outstanding, respectivelyCommon stock$76.00 KOther assetsOther assets$49.76 MRetained deficitAccumulated deficit−$339.49 MTreasury stock, 5,667,654 sharesBought back (treasury stock)−$61.47 MNoncontrolling interestsNoncontrolling interests−$89.00 K
Chart details

GREEN PLAINS INC. (GPRE) FY2026 Q2 Balance Sheet

Balance sheet as of 2026-06-30. The chart shows assets, liabilities and equity at that date.

Assets
1,657,067,000 US dollars
Current assets
625,452,000 US dollars
Non-current assets
1,031,615,000 US dollars
Liabilities
787,222,000 US dollars
Current liabilities
313,747,000 US dollars
Non-current liabilities
473,475,000 US dollars
Equity
869,845,000 US dollars
Noncontrolling interest
negative 89,000 US dollars. Included in consolidated equity; this amount is not added again.
Cash and cash equivalents
185,384,000 US dollars
Production tax credits
133,182,000 US dollars
Inventories
128,563,000 US dollars
Accounts receivable, net of allowances of $772 and $801, respectively
79,584,000 US dollars
Restricted cash
57,691,000 US dollars
Derivative financial instruments
23,997,000 US dollars
Prepaid expenses and other
17,051,000 US dollars
Property and equipment, net of accumulated depreciation ‎and amortization of $703,871 and $681,713, respectively
918,053,000 US dollars
Operating lease right-of-use assets
63,798,000 US dollars
Other assets
49,764,000 US dollars
Accounts payable
94,688,000 US dollars
Current maturities of long-term debt
69,510,000 US dollars
Accrued and other liabilities
42,530,000 US dollars
Unearned revenue
29,902,000 US dollars
Short-term notes payable and other borrowings
27,004,000 US dollars
Derivative financial instruments
26,605,000 US dollars
Operating lease current liabilities
23,508,000 US dollars
Long-term debt
387,176,000 US dollars
Operating lease long-term liabilities
41,436,000 US dollars
Other liabilities
32,503,000 US dollars
Carbon equipment liabilities
12,360,000 US dollars
Additional paid-in capital
1,268,815,000 US dollars
Accumulated other comprehensive income (loss)
2,006,000 US dollars
Common stock, $0.001 par value; 150,000,000 shares authorized; ‎75,765,934 and 75,495,731 shares issued, and 70,098,280 ‎and 69,828,077 shares outstanding, respectively
76,000 US dollars
Noncontrolling interests
negative 89,000 US dollars
Retained deficit
negative 339,489,000 US dollars
Treasury stock, 5,667,654 shares
negative 61,474,000 US dollars

Chart connections

  • Assets equal liabilities plus consolidated equity. Consolidated equity includes noncontrolling interests when reported.
  • Treasury shares and other negative equity contributions reduce equity.
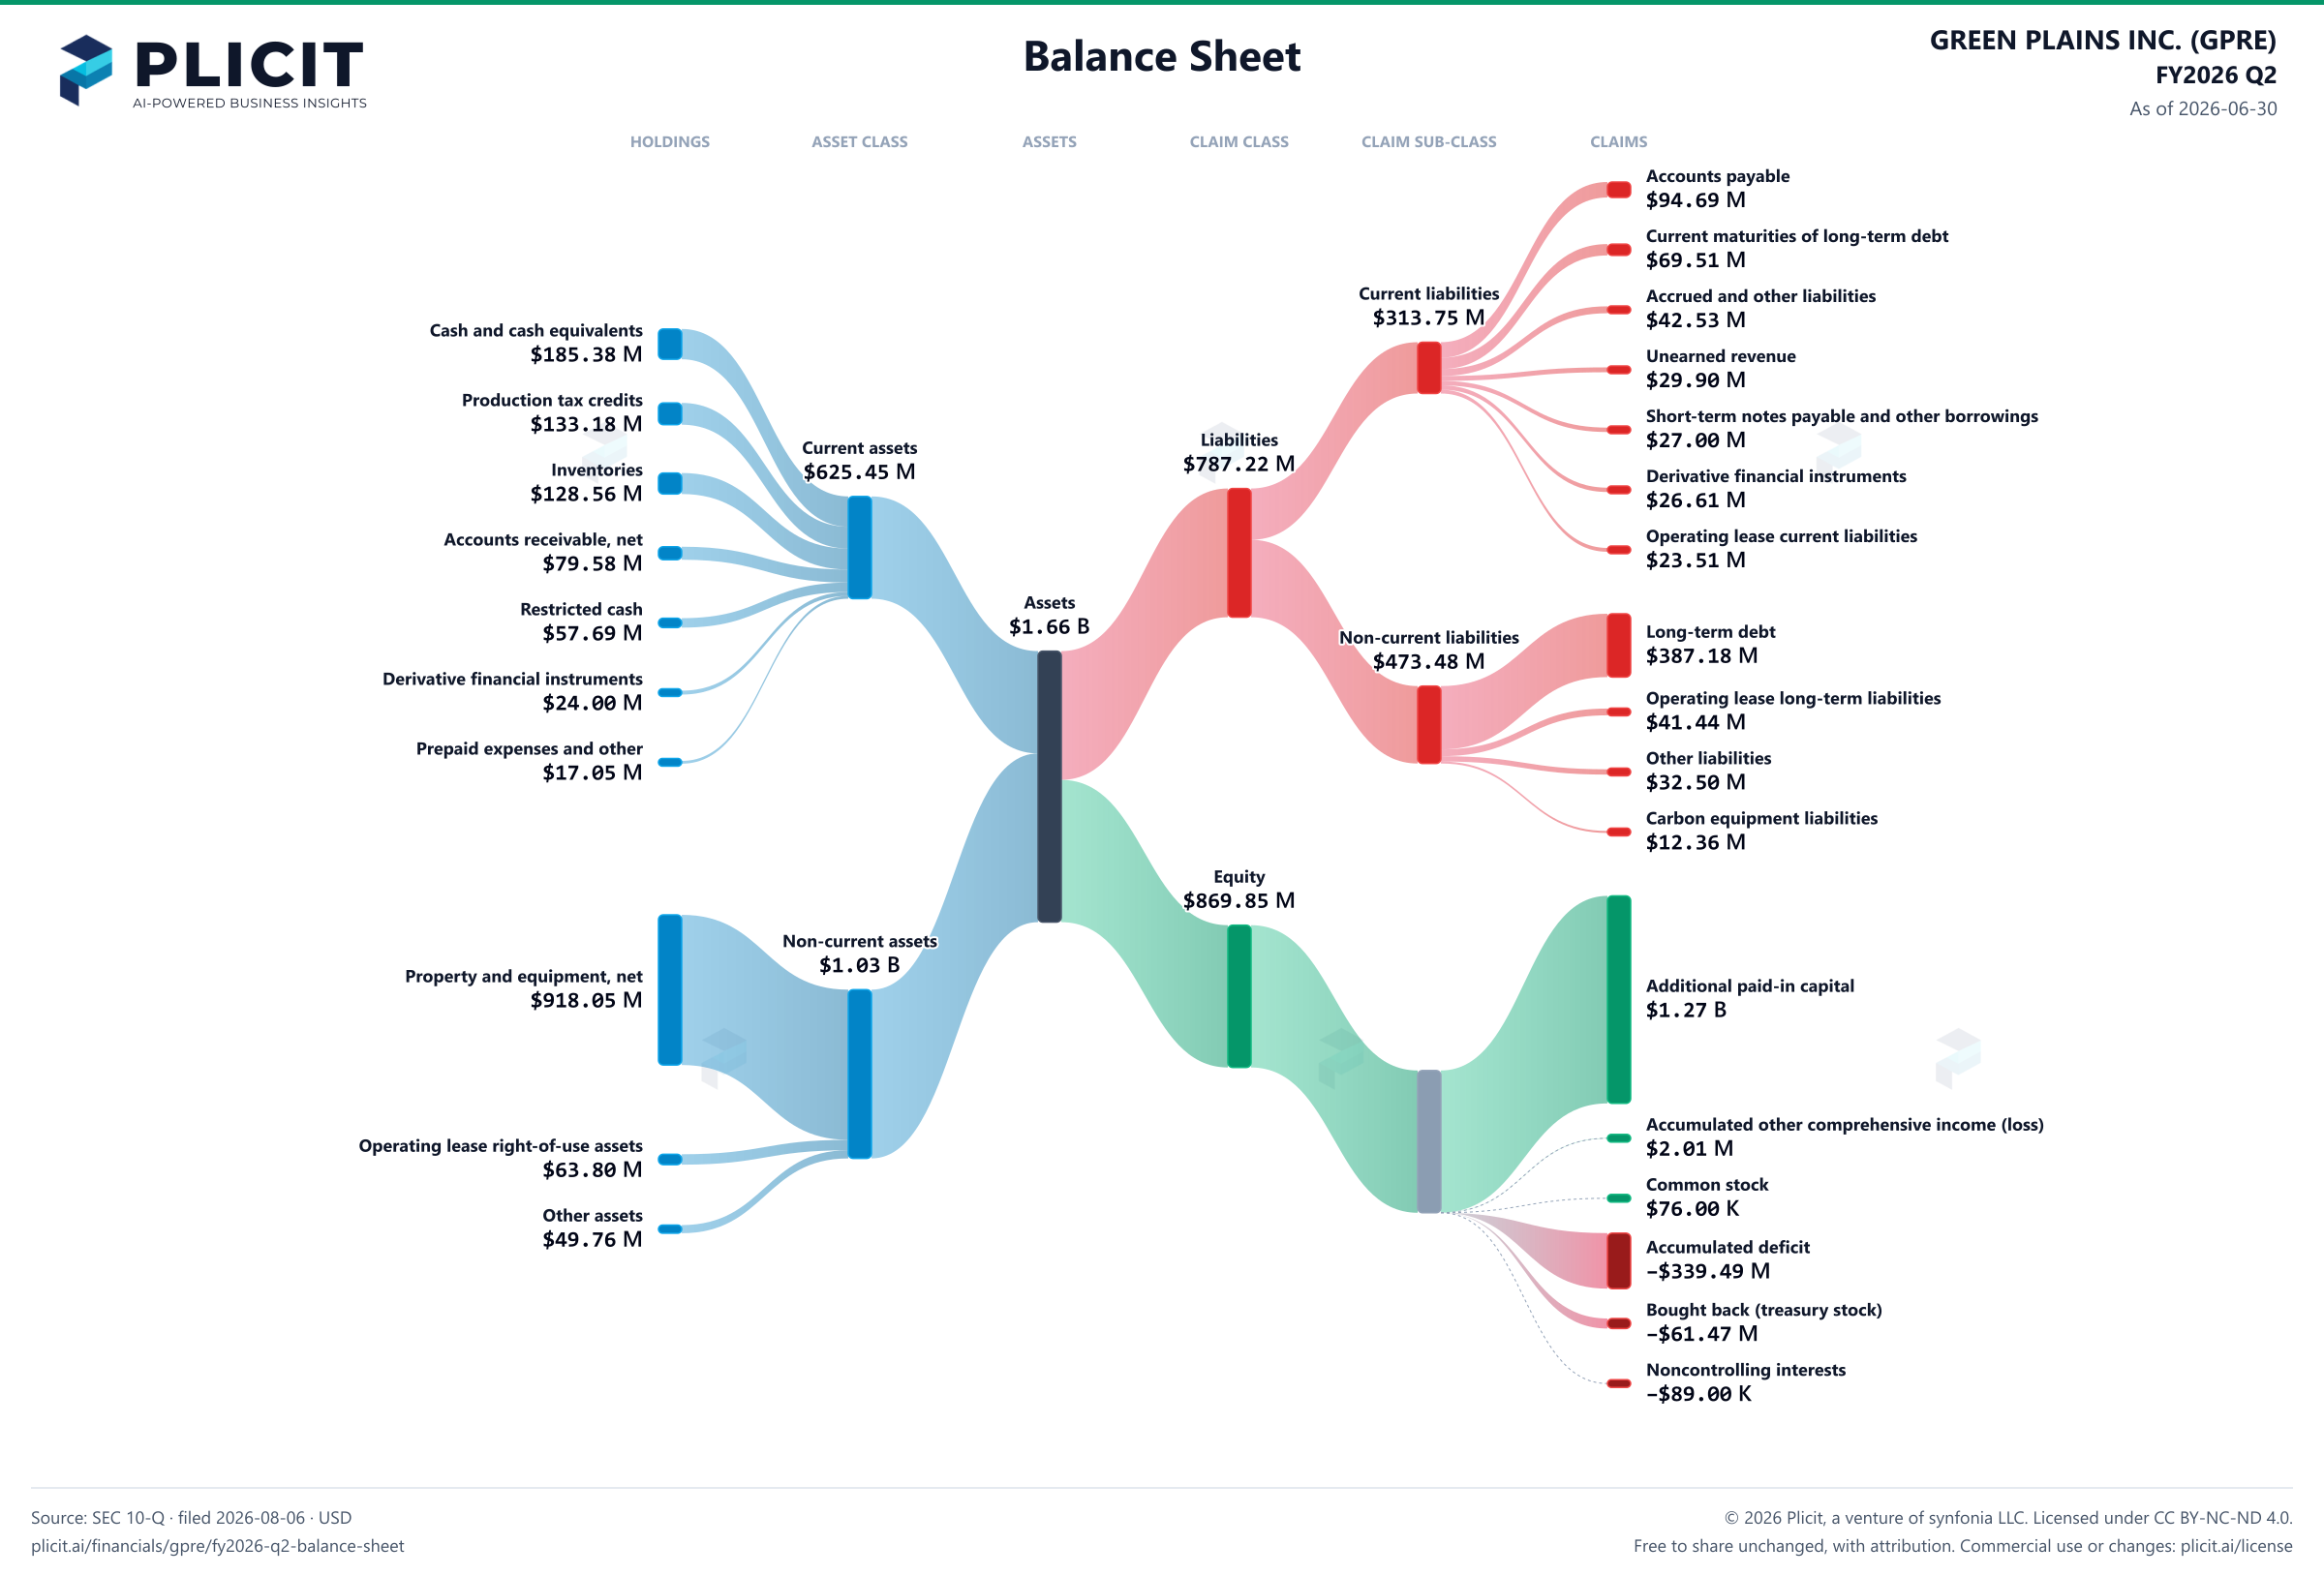
GREEN PLAINS INC. (GPRE) FY2026 Q2 Balance Sheet Sankey chart
Free to share unchanged, with credit to Plicit.ai · CC BY-NC-ND 4.0Download PNG

Product waitlist

Health Check and Teardown for your own company

A health check uncovers insights of your private books, not a public ticker. Join this list to get notified as soon as we go-live!