
Garrett Motion Inc. (GTX) FY2026 Q2 Balance Sheet

Balance Sheet

As of 2026-06-30

Swipe to see the full flow
Garrett Motion Inc. (GTX) FY2026 Q2 Balance SheetBalance sheet as of 2026-06-30. The chart shows assets, liabilities and equity at that date.Current liabilities$1.47 BLiabilities$3.15 BCurrent assets$1.47 BNon-current liabilities$1.68 BAssets$2.47 BNon-current assets$1.00 BEquity−$675.00 MHOLDINGSASSET CLASSASSETSCLAIM CLASSCLAIM SUB-CLASSCLAIMSAccounts, notes and other receivables – net (Note 6)Inventories – net (Note 8)Cash and cash equivalentsOther current assets (Note 9)Restricted cashProperty, plant and equipment – netDeferred income taxesGoodwillOther assets (Note 10)Investments and long-term receivablesAccounts payableAccrued liabilities (Note 12)Current maturities of long-term debt (Note 15)Long-term debt (Note 15)Other liabilities (Note 13)Deferred income taxesAdditional paid–in capitalRetained deficitTreasury Stock, at cost; $58,666,936 and 51,993,388 shares as of June 30, 2026 and December 31, 2025, respectively (Note 16)Accumulated other comprehensive loss (Note 18)Current assetsNon-current assetsAssetsCurrent liabilitiesNon-current liabilitiesLiabilitiesEquityCurrent liabilitiesCurrent liabilities$1.47 BLiabilitiesLiabilities$3.15 BAccounts payableAccounts payable$1.14 BAccrued liabilities (Note 12)Accrued liabilities (Note 12)$325.00 MCurrent maturities of long-term debt (Note 15)Current maturities of long-term debt (Note 15)$7.00 MCurrent assetsCurrent assets$1.47 BNon-current liabilitiesNon-current liabilities$1.68 BAccounts, notes and other receivables – net (Note 6)Accounts, notes and other receivables – net (Note 6)$836.00 MAssetsAssets$2.47 BLong-term debt (Note 15)Long-term debt (Note 15)$1.36 BInventories – net (Note 8)Inventories – net (Note 8)$350.00 MCash and cash equivalentsCash and cash equivalents$158.00 MOther current assets (Note 9)Other current assets (Note 9)$124.00 MOther liabilities (Note 13)Other liabilities (Note 13)$286.00 MRestricted cashRestricted cash$2.00 MDeferred income taxesDeferred income taxes$35.00 MProperty, plant and equipment – netProperty, plant and equipment – net$426.00 MNon-current assetsNon-current assets$1.00 BDeferred income taxesDeferred income taxes$207.00 MAdditional paid–in capitalAdditional paid–in capital$1.25 BGoodwillGoodwill$193.00 MEquityEquity−$675.00 MOther assets (Note 10)Other assets (Note 10)$167.00 MInvestments and long-term receivablesInvestments and long-term receivables$10.00 MRetained deficitRetained deficit−$1.22 BTreasury Stock, at cost; $58,666,936 and 51,993,388 shares as of June 30, 2026 and December 31, 2025, respectively (Note 16)Treasury Stock−$655.00 MAccumulated other comprehensive loss (Note 18)Accumulated other comprehensive loss (Note 18)−$54.00 M
Chart details

Garrett Motion Inc. (GTX) FY2026 Q2 Balance Sheet

Balance sheet as of 2026-06-30. The chart shows assets, liabilities and equity at that date.

Assets
2,473,000,000 US dollars
Current assets
1,470,000,000 US dollars
Non-current assets
1,003,000,000 US dollars
Liabilities
3,148,000,000 US dollars
Current liabilities
1,467,000,000 US dollars
Non-current liabilities
1,681,000,000 US dollars
Equity
negative 675,000,000 US dollars
Accounts, notes and other receivables – net (Note 6)
836,000,000 US dollars
Inventories – net (Note 8)
350,000,000 US dollars
Cash and cash equivalents
158,000,000 US dollars
Other current assets (Note 9)
124,000,000 US dollars
Restricted cash
2,000,000 US dollars
Property, plant and equipment – net
426,000,000 US dollars
Deferred income taxes
207,000,000 US dollars
Goodwill
193,000,000 US dollars
Other assets (Note 10)
167,000,000 US dollars
Investments and long-term receivables
10,000,000 US dollars
Accounts payable
1,135,000,000 US dollars
Accrued liabilities (Note 12)
325,000,000 US dollars
Current maturities of long-term debt (Note 15)
7,000,000 US dollars
Long-term debt (Note 15)
1,360,000,000 US dollars
Other liabilities (Note 13)
286,000,000 US dollars
Deferred income taxes
35,000,000 US dollars
Additional paid–in capital
1,254,000,000 US dollars
Common Stock, par value $0.001; 1,000,000,000 and 1,000,000,000 shares authorized, 245,457,621 and 242,549,685 issued and 186,800,685 and 190,556,297 outstanding as of June 30, 2026 and December 31, 2025, respectively
0 US dollars
Retained deficit
negative 1,220,000,000 US dollars
Treasury Stock, at cost; $58,666,936 and 51,993,388 shares as of June 30, 2026 and December 31, 2025, respectively (Note 16)
negative 655,000,000 US dollars
Accumulated other comprehensive loss (Note 18)
negative 54,000,000 US dollars

Chart connections

  • Assets equal liabilities plus consolidated equity. Consolidated equity includes noncontrolling interests when reported.
  • Treasury shares and other negative equity contributions reduce equity.
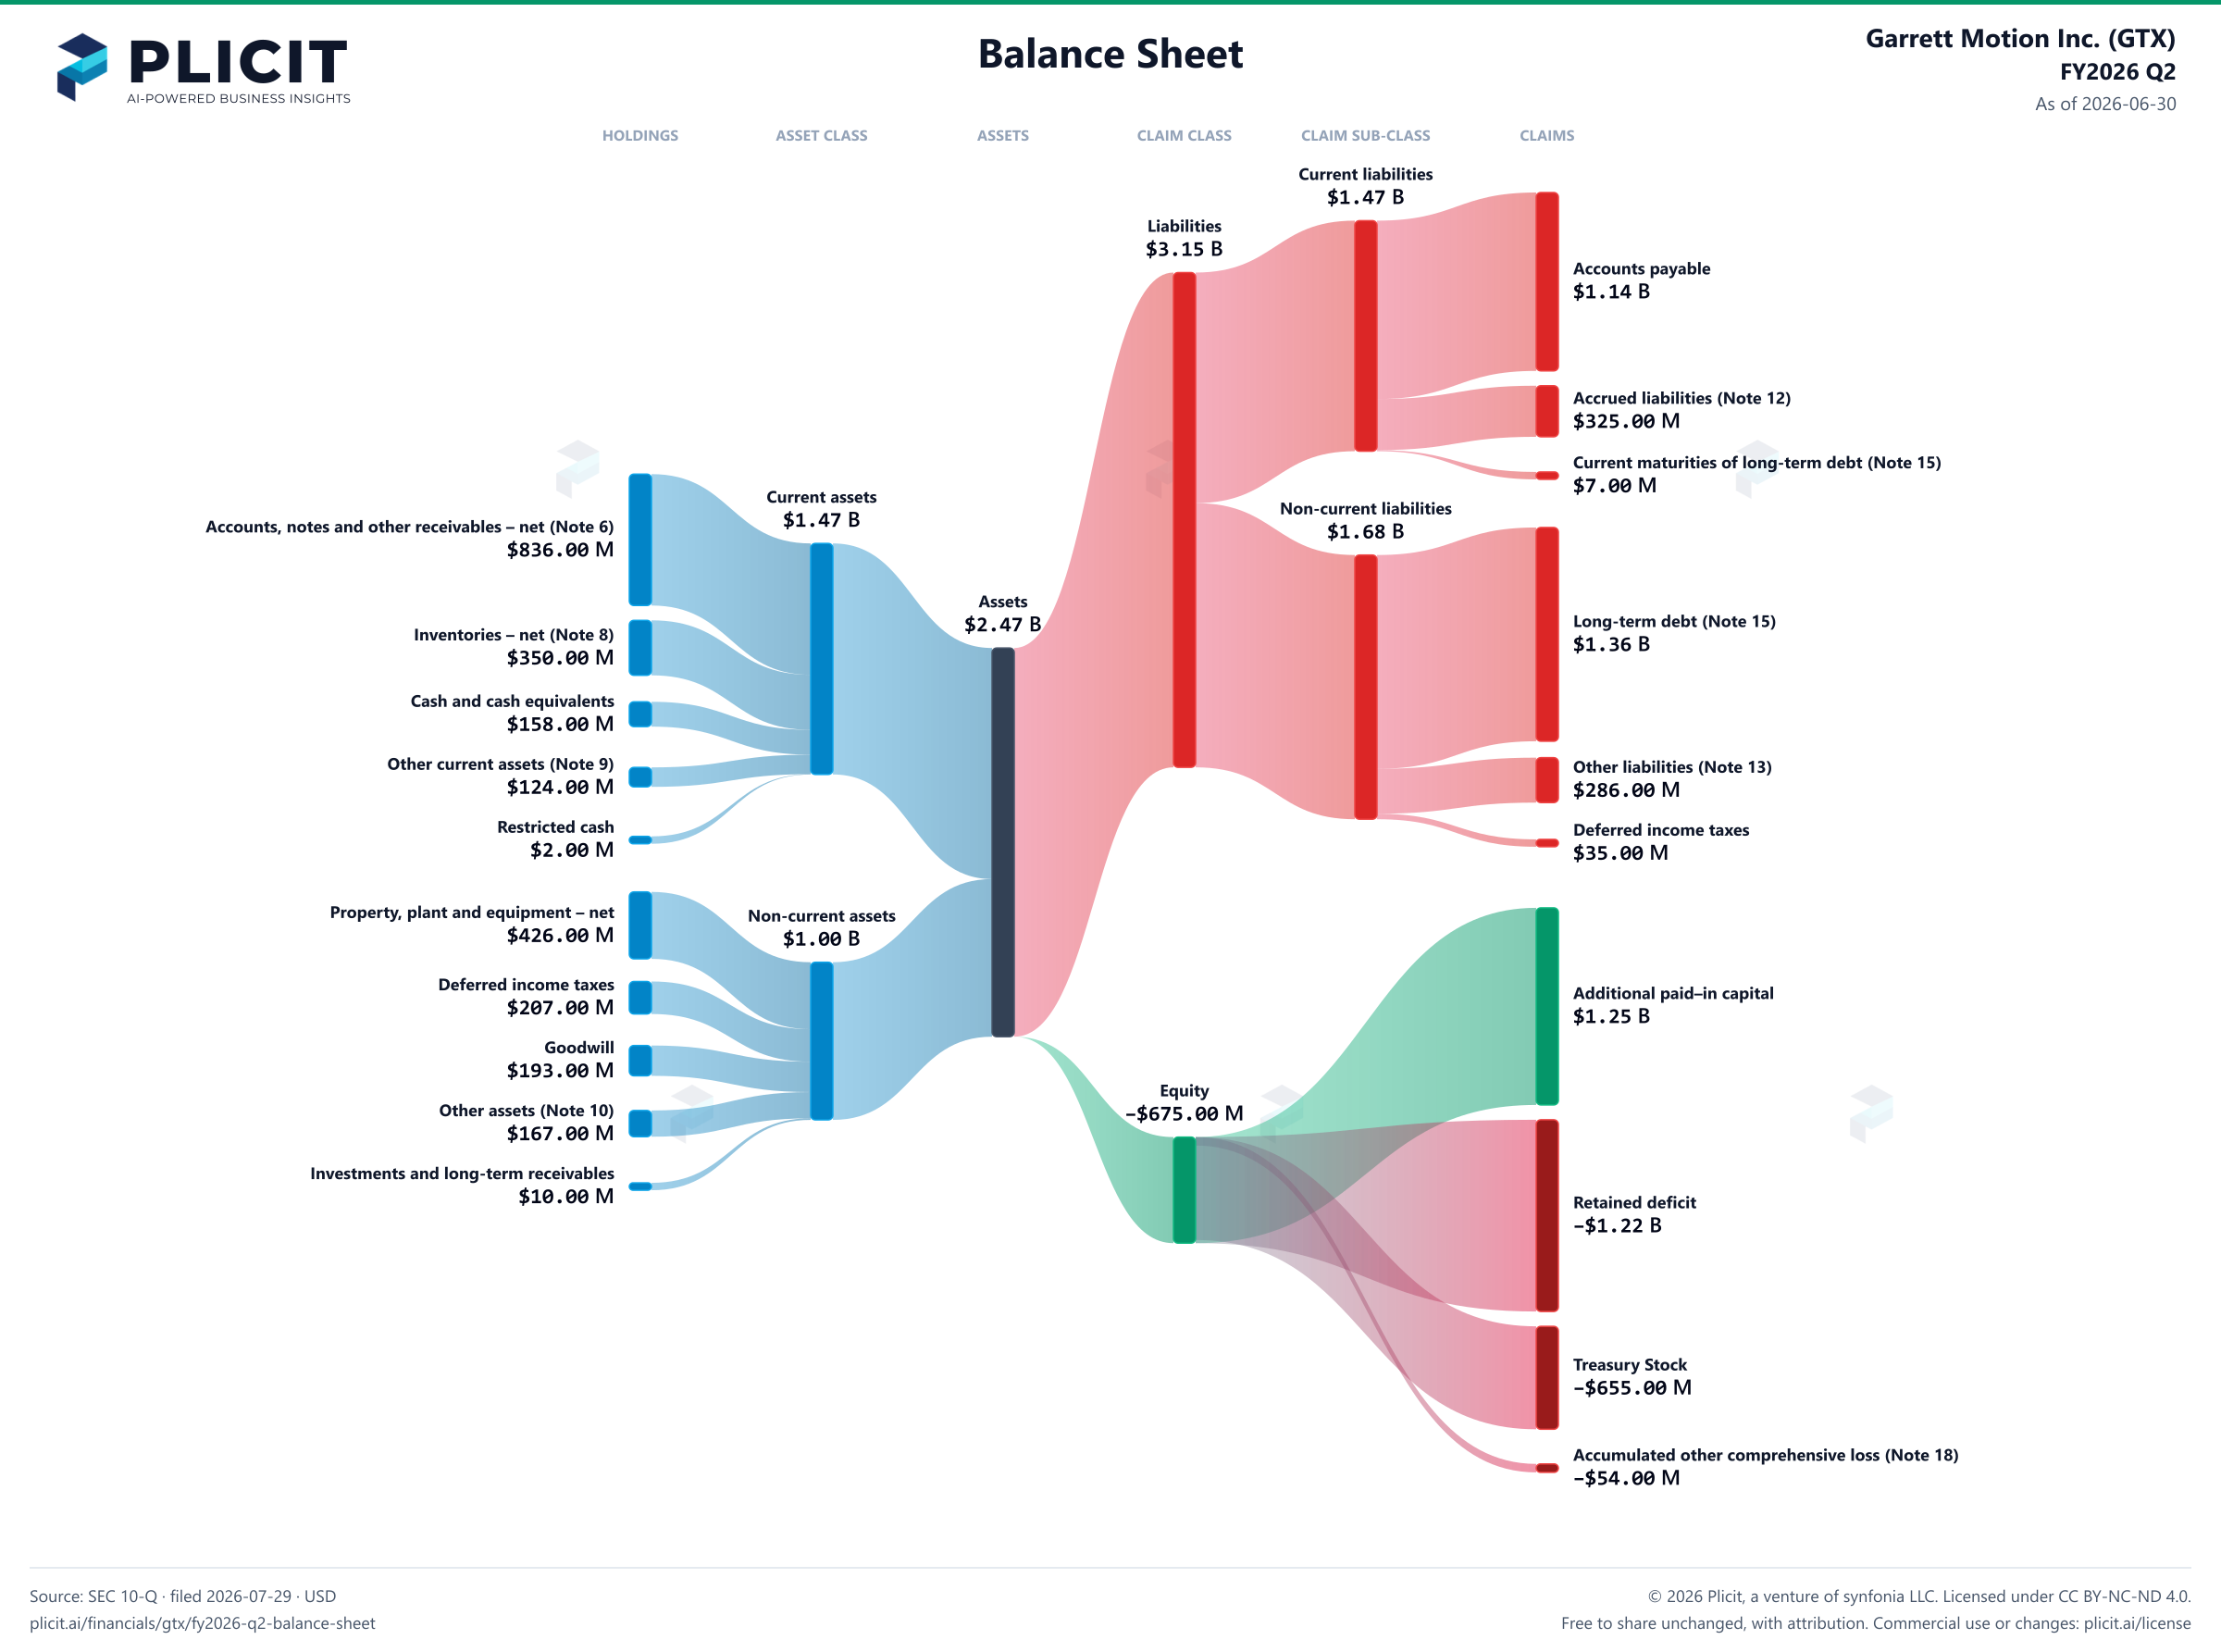
Garrett Motion Inc. (GTX) FY2026 Q2 Balance Sheet Sankey chart
Free to share unchanged, with credit to Plicit.ai · CC BY-NC-ND 4.0Download PNG

Newsletter

Get the teardowns by email

Subscribe if you want the public-company teardowns in your inbox when they're released.

Product waitlist

Health Check and Teardown for your own company

A health check uncovers insights of your private books, not a public ticker. Join this list to get notified as soon as we go-live!