
HCI Group, Inc. (HCI) FY2026 Q2 Balance Sheet

Balance Sheet

As of 2026-06-30

Swipe to see the full flow
HCI Group, Inc. (HCI) FY2026 Q2 Balance SheetBalance sheet as of 2026-06-30. The chart shows assets, liabilities and equity at that date.Liabilities$1.47 BAssets$2.65 BEquity$1.17 BGross equity(calculated)$1.18 BRedeemable noncontrolling interest$5.93 MHOLDINGSASSETSCLAIM CLASSCLAIM SUB-CLASSCLAIMSFixed-maturity securities, available-for-sale, at fair value (amortized cost: $1,103,778 and $595,383, respectively and allowance for credit losses: $0 and $0, respectively)Cash and cash equivalentsUnpaid losses and loss adjustment expenses (allowance: $73 and $97, respectively)Real estate investmentsPremiums receivable, net (allowance: $5,363 and $4,469, respectively)Deferred policy acquisition costsEquity securities, at fair value (cost: $55,700 and $61,597, respectively)Other assetsProperty and equipment, netPaid losses and loss adjustment expenses (allowance: $0 and $0, respectively)Limited partnership investmentsFunds withheld for assumed businessOther investmentsRestricted cashIntangible assets, netIncome taxes receivableDeferred income tax assets, netUnearned premiumsLosses and loss adjustment expensesAccrued expenses and other liabilitiesAdvance premiumsRevolving credit facilityCeded reinsurance premiums payableLong-term debtIncome taxes payableAssumed premiums payableDeferred income tax liabilities, netRetained earningsAdditional paid-in capitalNoncontrolling interestsAssetsLiabilitiesEquityGross equity (calculated)Accumulated other comprehensive (loss) incomeRedeemable noncontrolling interest (Note 16)Fixed-maturity securities, available-for-sale, at fair value (amortized cost: $1,103,778 and $595,383, respectively and allowance for credit losses: $0 and $0, respectively)Fixed-maturity securities,available-for-sale, at fair value$1.09 BUnearned premiumsUnearned premiums$659.34 MCash and cash equivalentsCash and cash equivalents$872.34 MLosses and loss adjustment expensesLosses and loss adjustment expenses$558.98 MLiabilitiesLiabilities$1.47 BUnpaid losses and loss adjustment expenses (allowance: $73 and $97, respectively)Unpaid losses and loss adjustment expenses$229.13 MAssetsAssets$2.65 BAccrued expenses and other liabilitiesAccrued expenses and other liabilities$82.89 MReal estate investmentsReal estate investments$102.67 MAdvance premiumsAdvance premiums$44.44 MPremiums receivable, net (allowance: $5,363 and $4,469, respectively)Premiums receivable, net$77.61 MRevolving credit facilityRevolving credit facility$36.00 MDeferred policy acquisition costsDeferred policy acquisition costs$68.21 MCeded reinsurance premiums payableCeded reinsurance premiums payable$34.77 MEquity securities, at fair value (cost: $55,700 and $61,597, respectively)Equity securities, at fair value$59.04 MLong-term debtLong-term debt$31.47 MOther assetsOther assets$58.91 MIncome taxes payableIncome taxes payable$16.47 MEquityEquity$1.17 BProperty and equipment, netProperty and equipment, net$27.50 MAssumed premiums payableAssumed premiums payable$4.05 MPaid losses and loss adjustment expenses (allowance: $0 and $0, respectively)Paid losses and loss adjustment expenses$26.61 MDeferred income tax liabilities, netDeferred income tax liabilities, net$1.00 MGross equity (calculated)Gross equity(calculated)$1.18 BLimited partnership investmentsLimited partnership investments$16.39 MRedeemable noncontrolling interest (Note 16)Redeemable noncontrolling interest$5.93 MRetained earningsRetained earnings$748.44 MFunds withheld for assumed businessFunds withheld for assumed business$5.35 MOther investmentsOther investments$5.00 MAdditional paid-in capitalAdditional paid-in capital$340.85 MRestricted cashRestricted cash$4.38 MNoncontrolling interestsNoncontrolling interests$93.22 MIntangible assets, netIntangible assets, net$1.92 MIncome taxes receivableIncome taxes receivable$1.28 MAccumulated other comprehensive (loss) incomeAccumulated other comprehensive (loss) income−$9.38 MDeferred income tax assets, netDeferred income tax assets, net$1.09 M
Chart details

HCI Group, Inc. (HCI) FY2026 Q2 Balance Sheet

Balance sheet as of 2026-06-30. The chart shows assets, liabilities and equity at that date.

Assets
2,648,459,000 US dollars
Liabilities
1,469,398,000 US dollars
Equity
1,173,132,000 US dollars
Redeemable noncontrolling interest (Note 16)
5,929,000 US dollars
Noncontrolling interest
93,223,000 US dollars. Included in consolidated equity; this amount is not added again.
Fixed-maturity securities, available-for-sale, at fair value (amortized cost: $1,103,778 and $595,383, respectively and allowance for credit losses: $0 and $0, respectively)
1,091,041,000 US dollars
Cash and cash equivalents
872,336,000 US dollars
Unpaid losses and loss adjustment expenses (allowance: $73 and $97, respectively)
229,131,000 US dollars
Real estate investments
102,669,000 US dollars
Premiums receivable, net (allowance: $5,363 and $4,469, respectively)
77,607,000 US dollars
Deferred policy acquisition costs
68,206,000 US dollars
Equity securities, at fair value (cost: $55,700 and $61,597, respectively)
59,038,000 US dollars
Other assets
58,908,000 US dollars
Property and equipment, net
27,503,000 US dollars
Paid losses and loss adjustment expenses (allowance: $0 and $0, respectively)
26,613,000 US dollars
Limited partnership investments
16,394,000 US dollars
Funds withheld for assumed business
5,346,000 US dollars
Other investments
5,000,000 US dollars
Restricted cash
4,378,000 US dollars
Intangible assets, net
1,924,000 US dollars
Income taxes receivable
1,277,000 US dollars
Deferred income tax assets, net
1,088,000 US dollars
Prepaid reinsurance premiums
0 US dollars
Unearned premiums
659,335,000 US dollars
Losses and loss adjustment expenses
558,982,000 US dollars
Accrued expenses and other liabilities
82,887,000 US dollars
Advance premiums
44,440,000 US dollars
Revolving credit facility
36,000,000 US dollars
Ceded reinsurance premiums payable
34,772,000 US dollars
Long-term debt
31,465,000 US dollars
Income taxes payable
16,467,000 US dollars
Assumed premiums payable
4,049,000 US dollars
Deferred income tax liabilities, net
1,001,000 US dollars
Retained earnings
748,437,000 US dollars
Additional paid-in capital
340,854,000 US dollars
Common stock (no par value, 40,000,000 shares authorized, 12,469,972 and 12,992,147 shares issued and outstanding, respectively)
0 US dollars
Noncontrolling interests
93,223,000 US dollars
Accumulated other comprehensive (loss) income
negative 9,382,000 US dollars
Gross equity (calculated)
1,182,514,000 US dollars. Net equity plus the magnitudes of its negative contributions equals gross positive equity. The negative contributions enter this reconciliation as add-backs; their filed signs stay negative.

Chart connections

  • Assets equal liabilities plus temporary equity plus consolidated equity. Consolidated equity includes noncontrolling interests when reported.
  • Treasury shares and other negative equity contributions reduce equity.
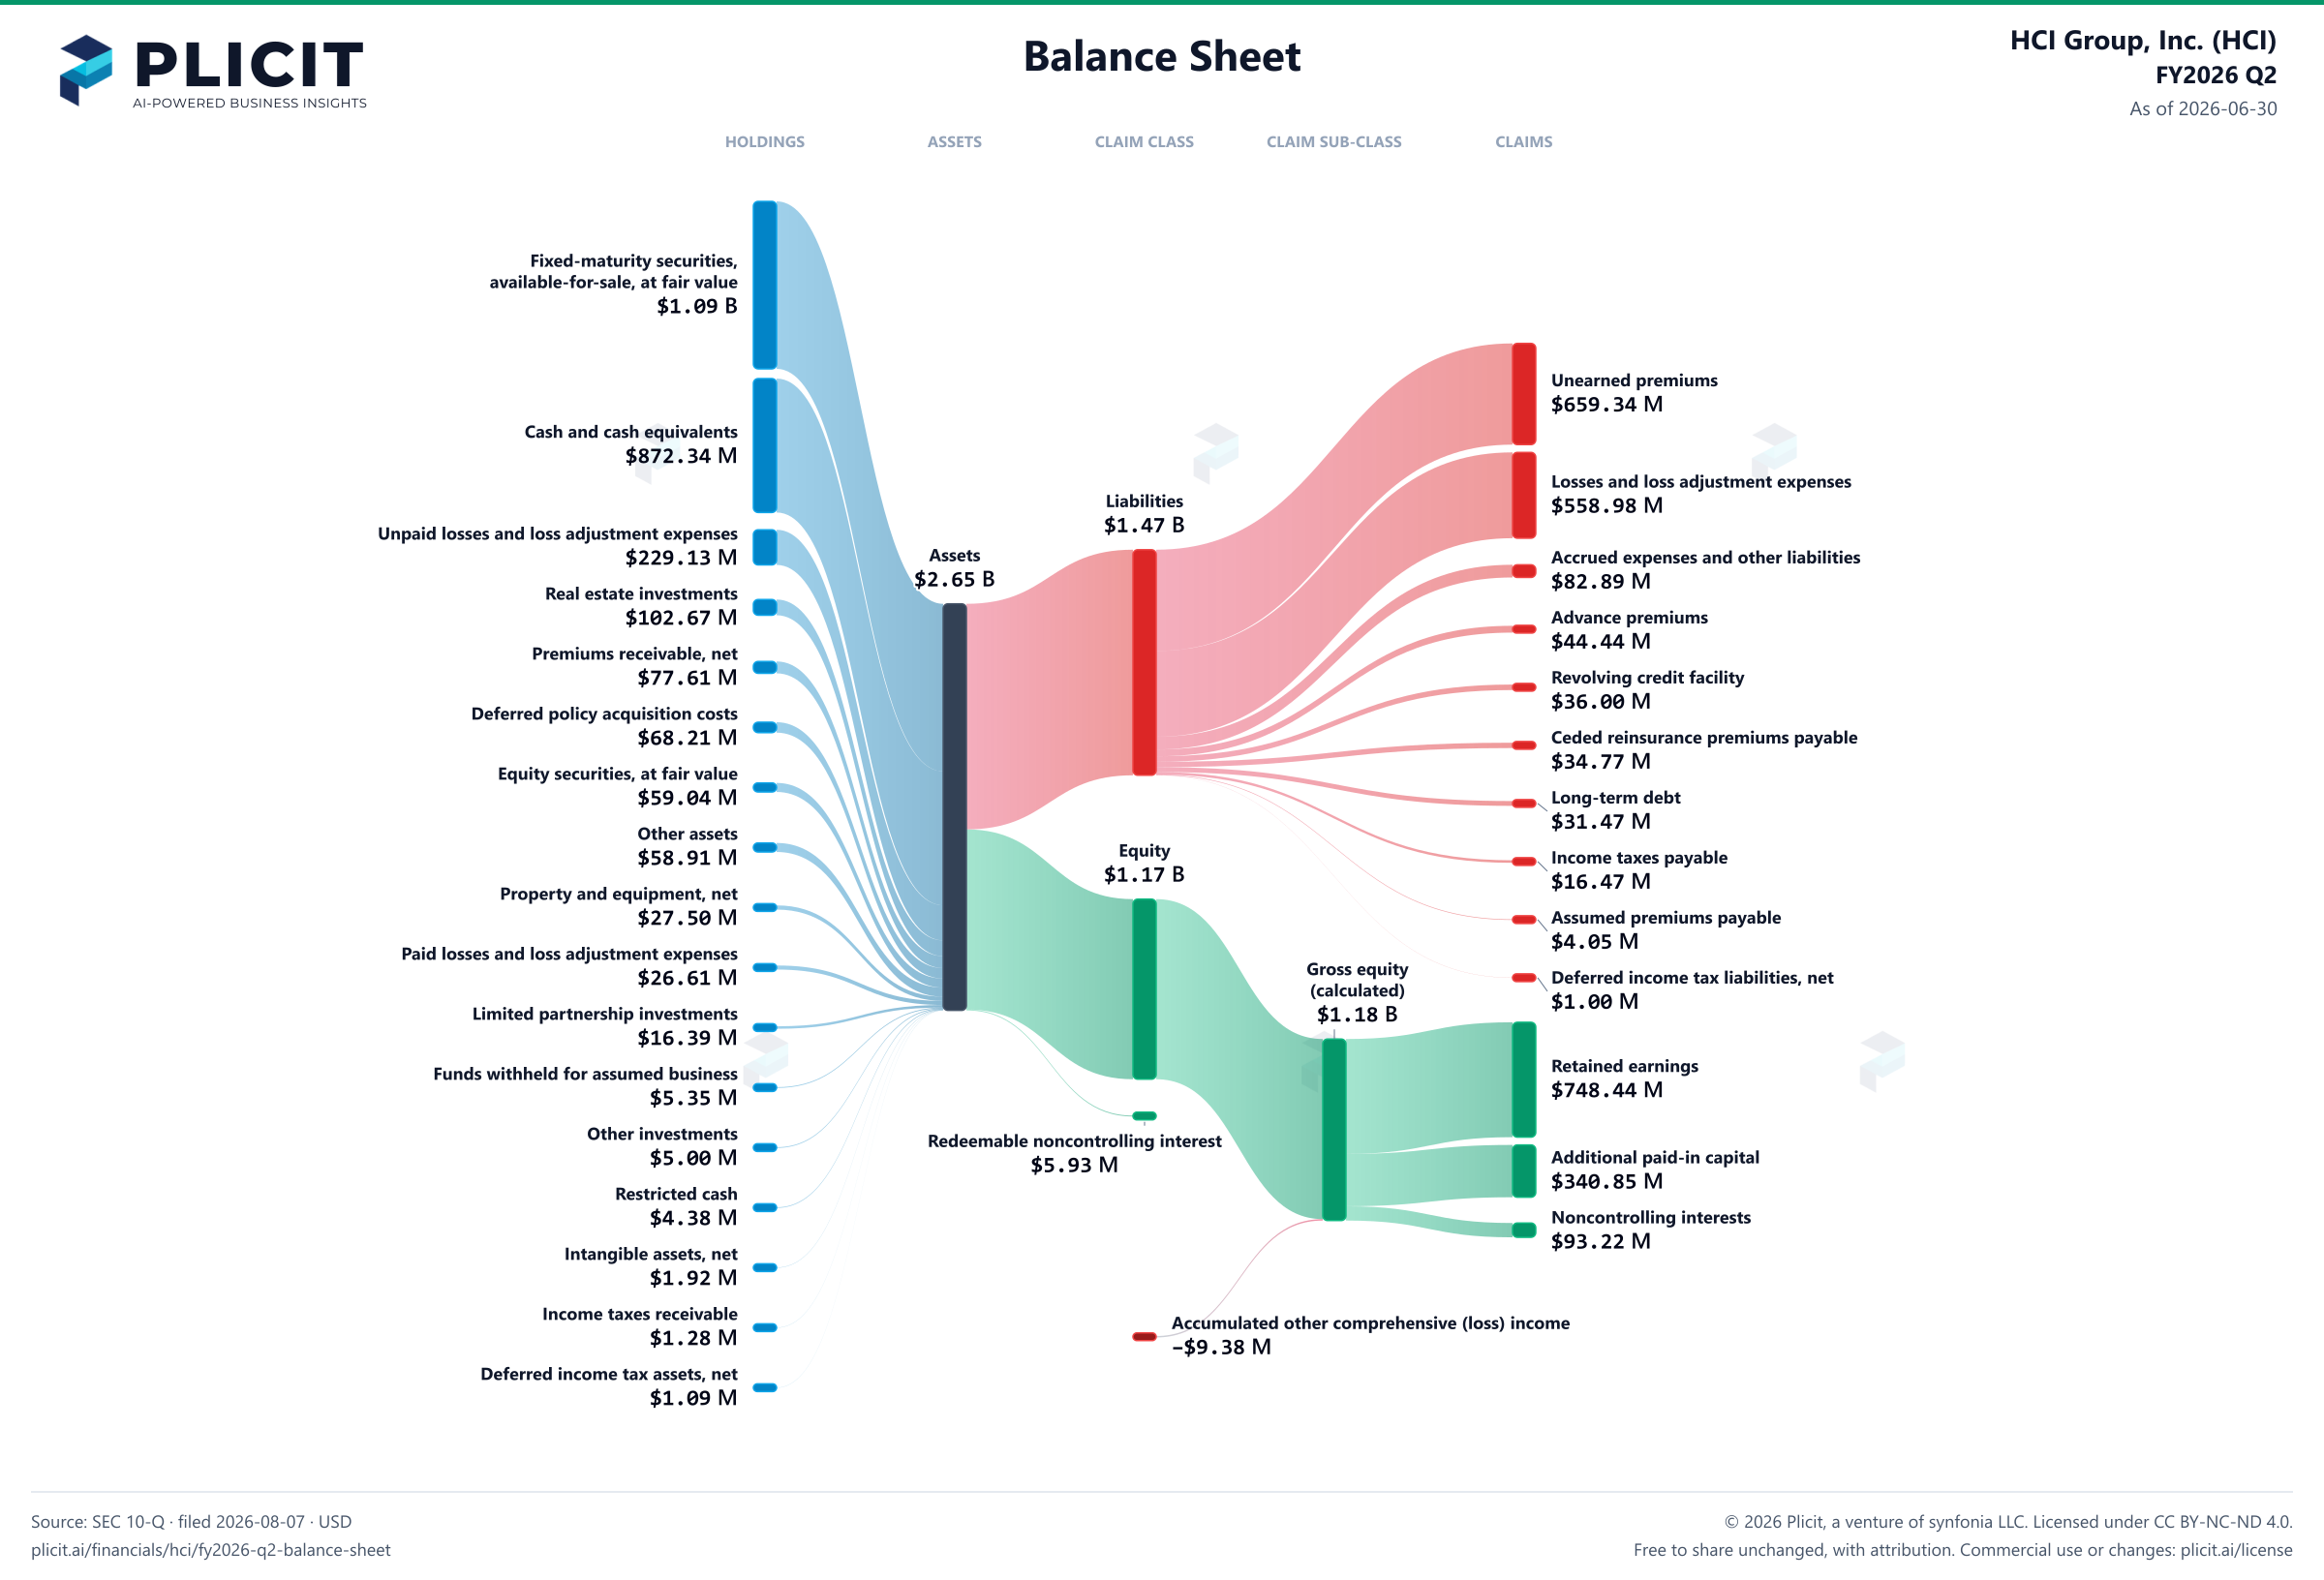
HCI Group, Inc. (HCI) FY2026 Q2 Balance Sheet Sankey chart
Free to share unchanged, with credit to Plicit.ai · CC BY-NC-ND 4.0Download PNG

Newsletter

Get the teardowns by email

Subscribe if you want the public-company teardowns in your inbox when they're released.

Product waitlist

Health Check and Teardown for your own company

A health check uncovers insights of your private books, not a public ticker. Join this list to get notified as soon as we go-live!