
The Hartford Insurance Group, Inc. (HIG) FY2025 Q2 Balance Sheet
As of 2025-06-30
Balance Sheet
As of 2025-06-30
Swipe to see the full flow
Chart details
The Hartford Insurance Group, Inc. (HIG) FY2025 Q2 Balance Sheet
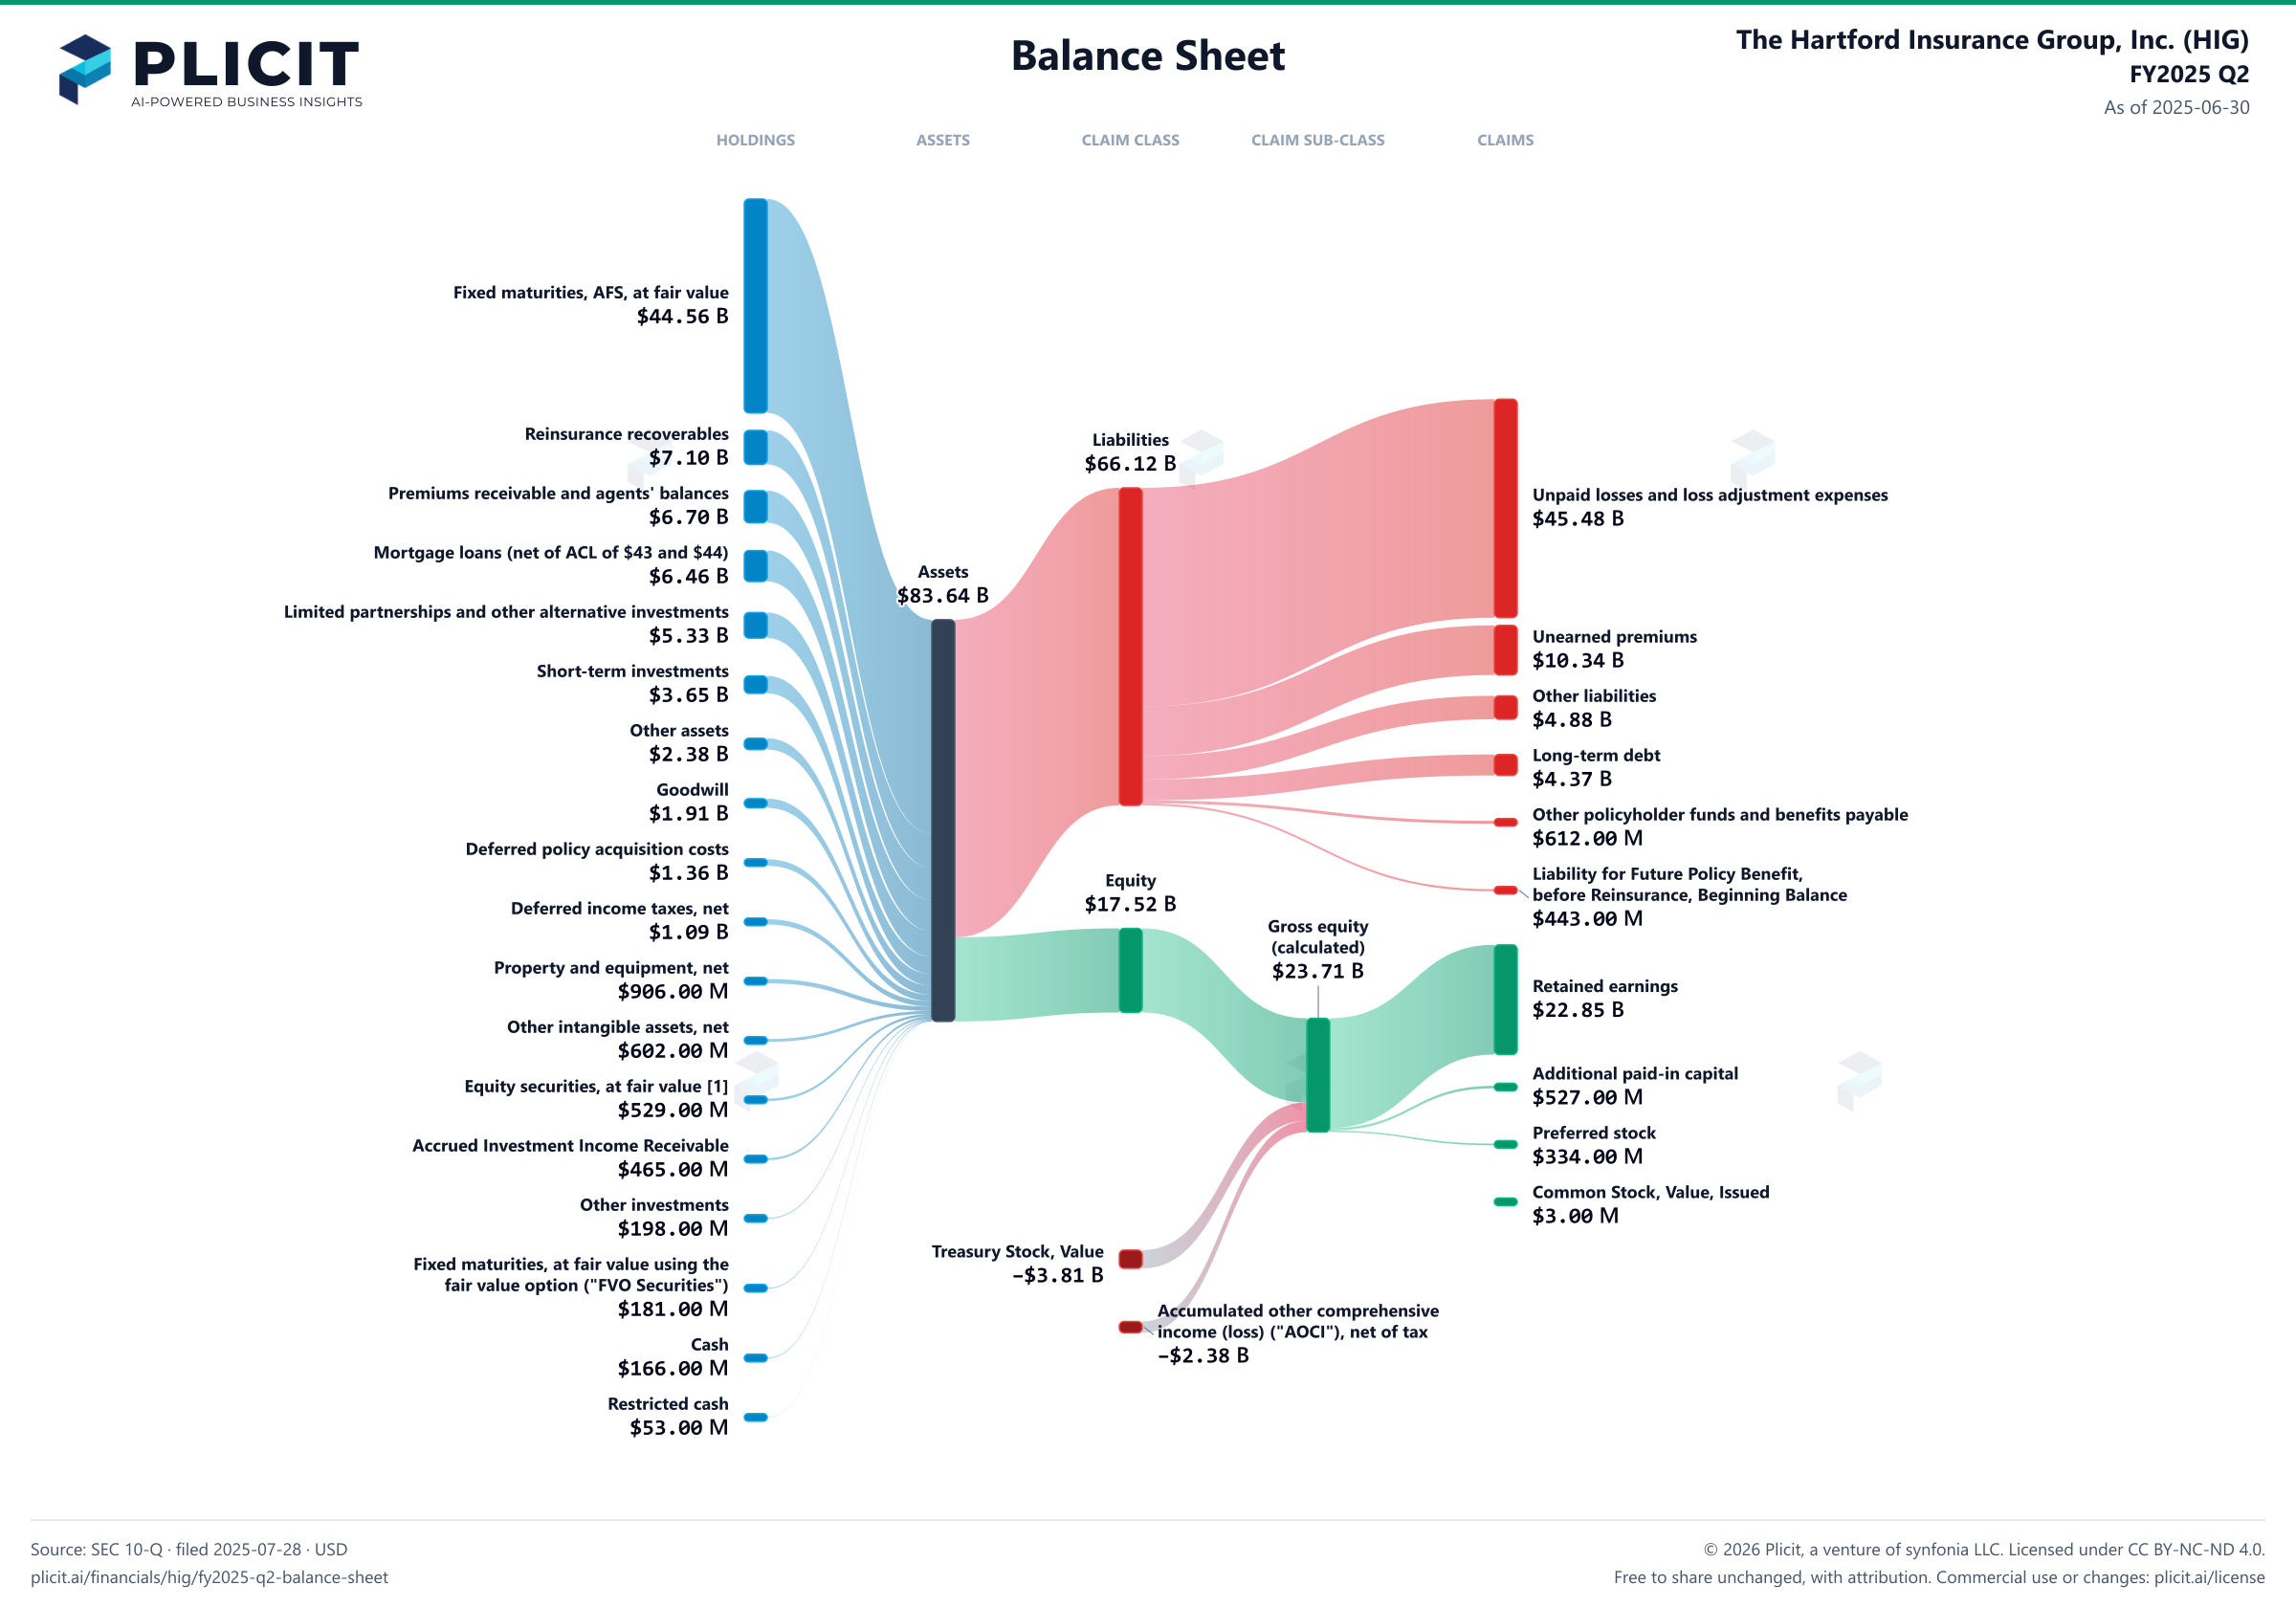
Balance sheet as of 2025-06-30. The chart shows assets, liabilities and equity at that date.
- Assets
- 83,639,000,000 US dollars
- Liabilities
- 66,121,000,000 US dollars
- Equity
- 17,518,000,000 US dollars
- Fixed maturities, AFS, at fair value (amortized cost of $45,880 and $44,538, and ACL of $14 and $16)
- 44,558,000,000 US dollars
- Reinsurance recoverables (net of allowance for uncollectible reinsurance of $75 and $75)
- 7,100,000,000 US dollars
- Premiums receivable and agents' balances (net of ACL of $135 and $117)
- 6,698,000,000 US dollars
- Mortgage loans (net of ACL of $43 and $44)
- 6,463,000,000 US dollars
- Limited partnerships and other alternative investments
- 5,325,000,000 US dollars
- Short-term investments
- 3,649,000,000 US dollars
- Other assets
- 2,379,000,000 US dollars
- Goodwill
- 1,911,000,000 US dollars
- Deferred policy acquisition costs
- 1,362,000,000 US dollars
- Deferred income taxes, net
- 1,094,000,000 US dollars
- Property and equipment, net
- 906,000,000 US dollars
- Other intangible assets, net
- 602,000,000 US dollars
- Equity securities, at fair value [1]
- 529,000,000 US dollars
- Accrued Investment Income Receivable
- 465,000,000 US dollars
- Other investments
- 198,000,000 US dollars
- Fixed maturities, at fair value using the fair value option ("FVO Securities")
- 181,000,000 US dollars
- Cash
- 166,000,000 US dollars
- Restricted cash
- 53,000,000 US dollars
- Unpaid losses and loss adjustment expenses
- 45,482,000,000 US dollars
- Unearned premiums
- 10,337,000,000 US dollars
- Other liabilities
- 4,878,000,000 US dollars
- Long-term debt
- 4,369,000,000 US dollars
- Other policyholder funds and benefits payable
- 612,000,000 US dollars
- Liability for Future Policy Benefit, before Reinsurance, Beginning Balance
- 443,000,000 US dollars
- Retained earnings
- 22,850,000,000 US dollars
- Additional paid-in capital
- 527,000,000 US dollars
- Preferred stock, $0.01 par value — 50,000,000 shares authorized, 13,800 shares issued at June 30, 2025 and December 31, 2024, aggregate liquidation preference of $345
- 334,000,000 US dollars
- Common Stock, Value, Issued
- 3,000,000 US dollars
- Treasury Stock, Value
- negative 3,812,000,000 US dollars
- Accumulated other comprehensive income (loss) ("AOCI"), net of tax
- negative 2,384,000,000 US dollars
- Gross equity (calculated)
- 23,714,000,000 US dollars. Net equity plus the magnitudes of its negative contributions equals gross positive equity. The negative contributions enter this reconciliation as add-backs; their filed signs stay negative.
Chart connections
- Assets equal liabilities plus consolidated equity. Consolidated equity includes noncontrolling interests when reported.
- Treasury shares and other negative equity contributions reduce equity.
Free to share unchanged, with credit to Plicit.ai · CC BY-NC-ND 4.0Download PNG
Product waitlist
Health Check and Teardown for your own company
A health check uncovers insights of your private books, not a public ticker. Join this list to get notified as soon as we go-live!