
HUNTINGTON INGALLS INDUSTRIES, INC. (HII) FY2026 Q2 Balance Sheet

Balance Sheet

As of 2026-06-30

Swipe to see the full flow
HUNTINGTON INGALLS INDUSTRIES, INC. (HII) FY2026 Q2 Balance SheetBalance sheet as of 2026-06-30. The chart shows assets, liabilities and equity at that date.Current liabilities$2.63 BLiabilities$7.37 BCurrent assets$3.24 BAssets$12.68 BNon-current liabilities$4.74 BNon-current assets$9.44 BEquity$5.31 BGross equity(calculated)$7.81 BHOLDINGSASSET CLASSASSETSCLAIM CLASSCLAIM SUB-CLASSCLAIMSContract assetsAccounts receivable, netIncome taxes receivableInventoried costs, netPrepaid expenses and other current assetsCash and cash equivalentsProperty, plant, and equipment, netGoodwillPension plan assetsOther intangible assets, netMiscellaneous other assetsOperating lease assetsTrade accounts payableContract liabilitiesOther Liabilities, CurrentAccrued employees' compensationCurrent portion of workers' compensation liabilitiesCurrent portion of postretirement plan liabilitiesLong-term debtDeferred tax liabilitiesWorkers' compensation liabilitiesOther long-term liabilitiesLong-term operating lease liabilitiesOther postretirement plan liabilitiesPension plan liabilitiesRetained earnings (deficit)Additional paid-in capitalCommon stockCurrent assetsNon-current assetsAssetsCurrent liabilitiesNon-current liabilitiesLiabilitiesEquityGross equity (calculated)Treasury stockAccumulated other comprehensive income (loss)Trade accounts payableTrade accounts payable$737.00 MContract liabilitiesContract liabilities$690.00 MCurrent liabilitiesCurrent liabilities$2.63 BOther Liabilities, CurrentOther Liabilities, Current$481.00 MContract assetsContract assets$2.15 BAccrued employees' compensationAccrued employees' compensation$386.00 MLiabilitiesLiabilities$7.37 BCurrent assetsCurrent assets$3.24 BAccounts receivable, netAccounts receivable, net$452.00 MCurrent portion of workers' compensation liabilitiesCurrent portion of workers' compensation liabilities$220.00 MIncome taxes receivableIncome taxes receivable$279.00 MCurrent portion of postretirement plan liabilitiesCurrent portion of postretirement plan liabilities$119.00 MAssetsAssets$12.68 BInventoried costs, netInventoried costs, net$236.00 MLong-term debtLong-term debt$2.70 BPrepaid expenses and other current assetsPrepaid expenses and other current assets$106.00 MNon-current liabilitiesNon-current liabilities$4.74 BDeferred tax liabilitiesDeferred tax liabilities$662.00 MCash and cash equivalentsCash and cash equivalents$12.00 MWorkers' compensation liabilitiesWorkers' compensation liabilities$450.00 MNon-current assetsNon-current assets$9.44 BOther long-term liabilitiesOther long-term liabilities$346.00 MProperty, plant, and equipment, netProperty, plant, and equipment, net$3.81 BEquityEquity$5.31 BLong-term operating lease liabilitiesLong-term operating lease liabilities$233.00 MOther postretirement plan liabilitiesOther postretirement plan liabilities$189.00 MGoodwillGoodwill$2.65 BPension plan liabilitiesPension plan liabilities$155.00 MGross equity (calculated)Gross equity(calculated)$7.81 BPension plan assetsPension plan assets$1.63 BOther intangible assets, netOther intangible assets, net$651.00 MRetained earnings (deficit)Retained earnings (deficit)$5.73 BMiscellaneous other assetsMiscellaneous other assets$427.00 MOperating lease assetsOperating lease assets$282.00 MAdditional paid-in capitalAdditional paid-in capital$2.08 BCommon stockCommon stock$1.00 MTreasury stockTreasury stock−$2.45 BAccumulated other comprehensive income (loss)Accumulated other comprehensive income (loss)−$50.00 M
Chart details

HUNTINGTON INGALLS INDUSTRIES, INC. (HII) FY2026 Q2 Balance Sheet

Balance sheet as of 2026-06-30. The chart shows assets, liabilities and equity at that date.

Assets
12,682,000,000 US dollars
Current assets
3,239,000,000 US dollars
Non-current assets
9,443,000,000 US dollars
Liabilities
7,370,000,000 US dollars
Current liabilities
2,633,000,000 US dollars
Non-current liabilities
4,737,000,000 US dollars
Equity
5,312,000,000 US dollars
Contract assets
2,154,000,000 US dollars
Accounts receivable, net
452,000,000 US dollars
Income taxes receivable
279,000,000 US dollars
Inventoried costs, net
236,000,000 US dollars
Prepaid expenses and other current assets
106,000,000 US dollars
Cash and cash equivalents
12,000,000 US dollars
Property, plant, and equipment, net
3,806,000,000 US dollars
Goodwill
2,650,000,000 US dollars
Pension plan assets
1,627,000,000 US dollars
Other intangible assets, net
651,000,000 US dollars
Miscellaneous other assets
427,000,000 US dollars
Operating lease assets
282,000,000 US dollars
Trade accounts payable
737,000,000 US dollars
Contract liabilities
690,000,000 US dollars
Other Liabilities, Current
481,000,000 US dollars
Accrued employees' compensation
386,000,000 US dollars
Current portion of workers' compensation liabilities
220,000,000 US dollars
Current portion of postretirement plan liabilities
119,000,000 US dollars
Long-term debt
2,702,000,000 US dollars
Deferred tax liabilities
662,000,000 US dollars
Workers' compensation liabilities
450,000,000 US dollars
Other long-term liabilities
346,000,000 US dollars
Long-term operating lease liabilities
233,000,000 US dollars
Other postretirement plan liabilities
189,000,000 US dollars
Pension plan liabilities
155,000,000 US dollars
Retained earnings (deficit)
5,730,000,000 US dollars
Additional paid-in capital
2,080,000,000 US dollars
Common stock
1,000,000 US dollars
Treasury stock
negative 2,449,000,000 US dollars
Accumulated other comprehensive income (loss)
negative 50,000,000 US dollars
Gross equity (calculated)
7,811,000,000 US dollars. Net equity plus the magnitudes of its negative contributions equals gross positive equity. The negative contributions enter this reconciliation as add-backs; their filed signs stay negative.

Chart connections

  • Assets equal liabilities plus consolidated equity. Consolidated equity includes noncontrolling interests when reported.
  • Treasury shares and other negative equity contributions reduce equity.
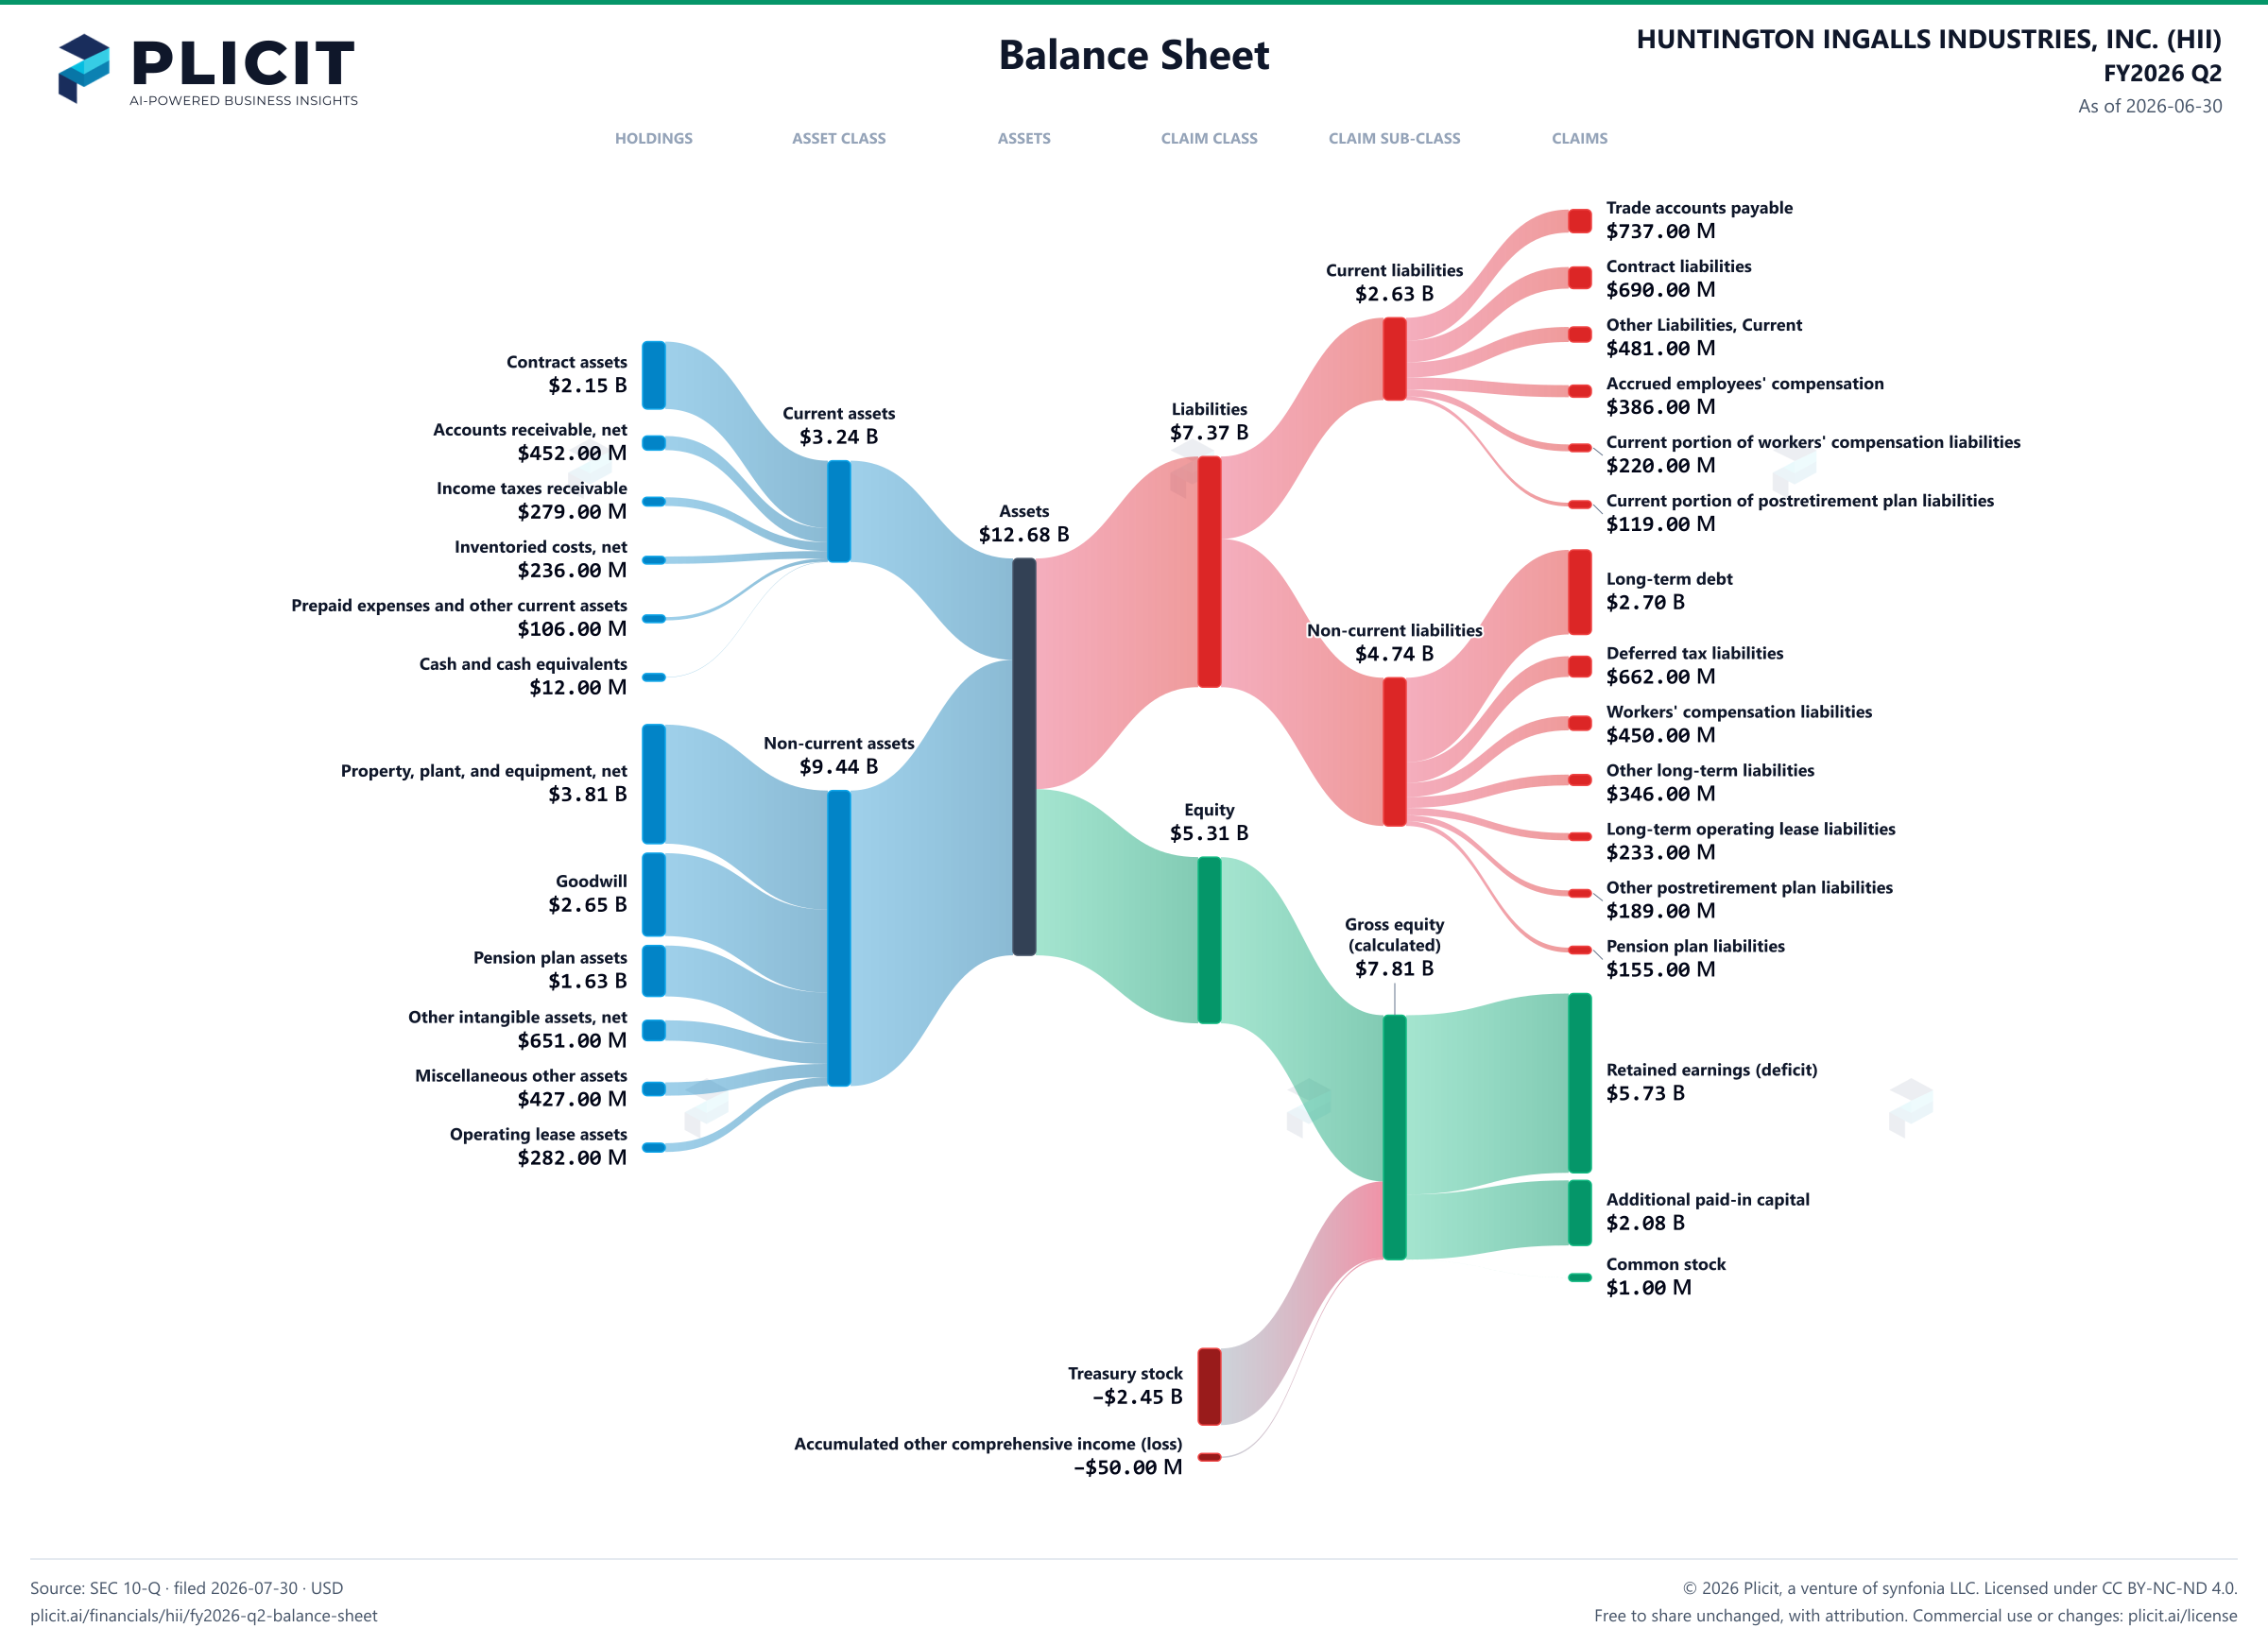
HUNTINGTON INGALLS INDUSTRIES, INC. (HII) FY2026 Q2 Balance Sheet Sankey chart
Free to share unchanged, with credit to Plicit.ai · CC BY-NC-ND 4.0Download PNG

Newsletter

Get the teardowns by email

Subscribe if you want the public-company teardowns in your inbox when they're released.

Product waitlist

Health Check and Teardown for your own company

A health check uncovers insights of your private books, not a public ticker. Join this list to get notified as soon as we go-live!