
Published · Updated Source: Form 10-Q on SEC EDGAR filed (opens in a new tab)

Key Takeaways

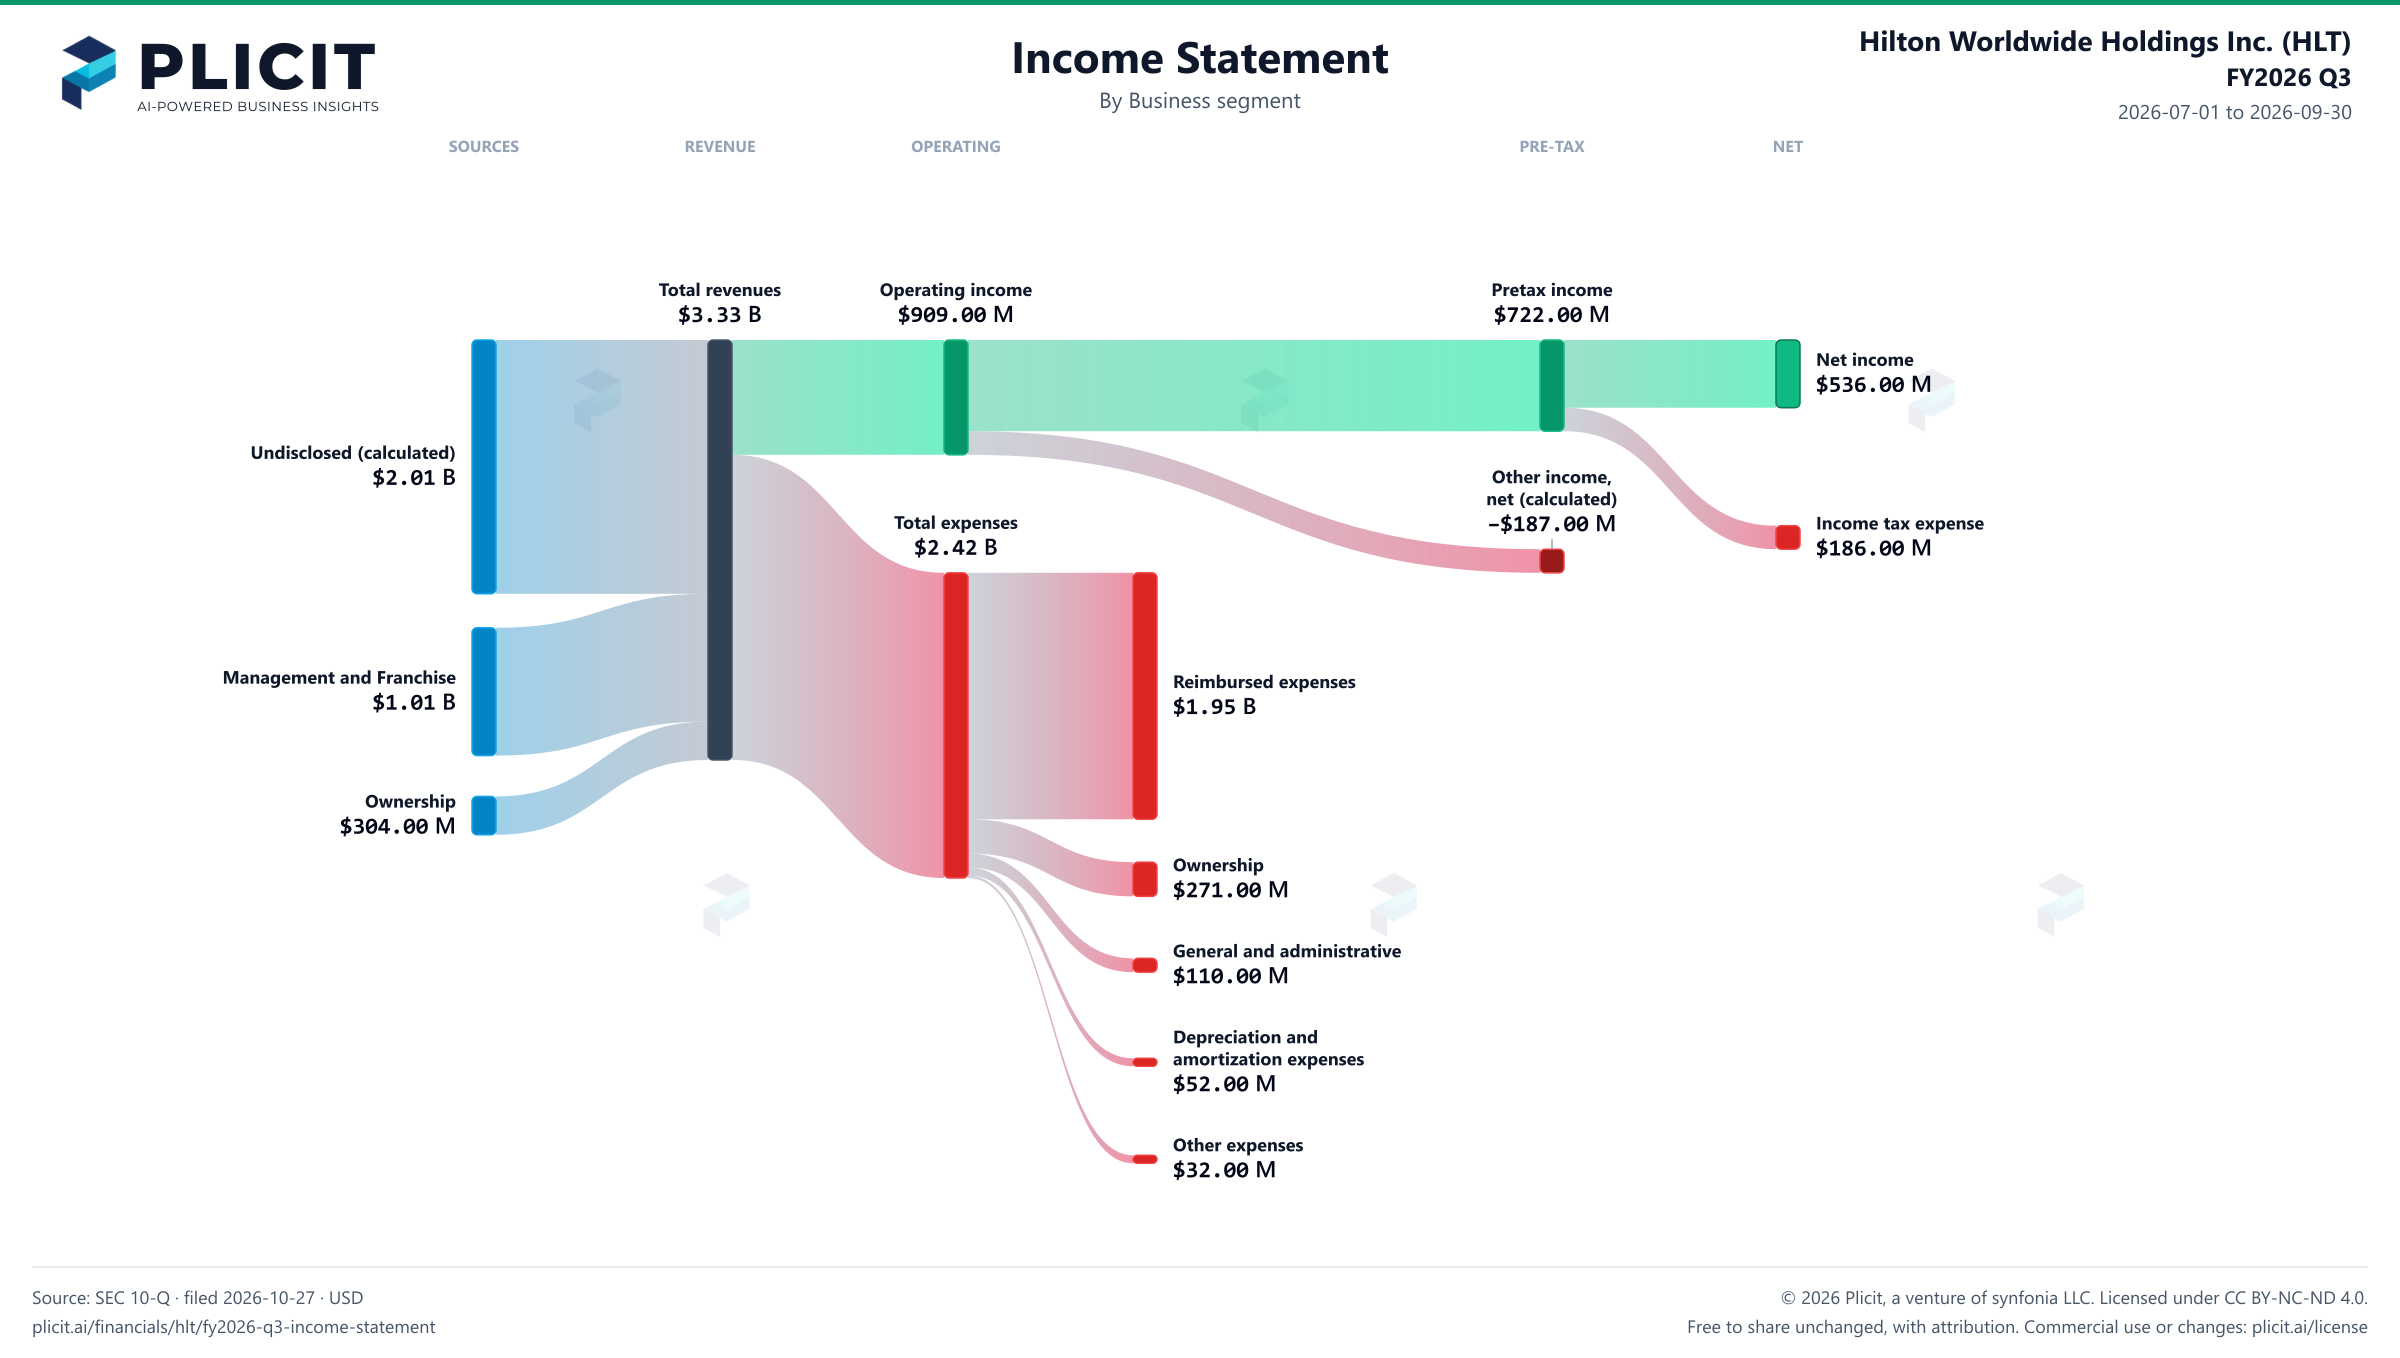
  • Management and Franchise brought in $1.01 B, or 30% of revenue, against $304.00 M for Ownership.
  • Ownership fell 5.6% while total revenue rose 6.6% from a year earlier.
  • Management and Franchise added $84.00 M of the $205.00 M revenue gain from a year earlier.
  • Ownership is the one part that moved backward, down $18.00 M of revenue.

The Unvarnished Truth

Management and Franchise earns 30% of sales while Ownership shrinks

Hilton's biggest business is a fee business, and the part that owns hotels is the one shrinking. Management and Franchise brought in $1.01 B this quarter, 30% of the $3.33 B total, and it grew 9% from a year earlier. Ownership, which runs the hotels the company actually owns, fell from $322.00 M to $304.00 M. The company says it has 45 hotels in that segment. That is the number to watch, because it is the only part of the mix moving backward.

Why do the segments look so small? The two segments above add to $1.32 B of revenue, while the filing's total is $3.33 B. The gap is mostly cost reimbursement revenue of $1.97 B, which the company says it does not run to make a profit. Hilton says those programs exist for the benefit of property owners and recover prior expenses, so the biggest revenue line sits outside the segments this chart ranks. About 60% of revenue sits outside the ranked bars.

Read this view as the company's own map, not the whole business. Cost reimbursement revenue is 59% of the total, and Hilton says those programs are not run to make a profit. The filing blames the ownership decline on renovations and one exited hotel. Ownership revenue fell $18.00 M this quarter, a small number that still points the wrong way. Will the segment that keeps 45 hotels grow back once the renovations are done, or is the decline the start of a longer slide?
Revenue by Business Segment

Swipe to see the full flow
Hilton Worldwide Holdings Inc. (HLT) FY2026 Q3 P&L / Income StatementIncome statement for 2026-07-01 through 2026-09-30. View: Business segment. Revenue uses this breakdown; costs and expenses retain the consolidated categories.SOURCESREVENUEOPERATINGPRE-TAXNETUndisclosed (calculated)Management and FranchiseOwnership revenueTotal revenuesOperating incomeTotal expensesReimbursed expensesOwnership expenseGeneral and administrativeDepreciation and amortization expensesOther expensesIncome before income taxesOther income (expense), net (calculated)Net incomeIncome tax expenseTotal revenuesTotal revenues$3.33 BOperating incomeOperating income$909.00 MIncome before income taxesPretax income$722.00 MNet incomeNet income$536.00 MUndisclosed (calculated)Undisclosed (calculated)$2.01 BTotal expensesTotal expenses$2.42 BIncome tax expenseIncome tax expense$186.00 MOther income (expense), net (calculated)Other income,net (calculated)−$187.00 MManagement and FranchiseManagement and Franchise$1.01 BReimbursed expensesReimbursed expenses$1.95 BOwnership revenueOwnership$304.00 MOwnership expenseOwnership$271.00 MGeneral and administrativeGeneral and administrative$110.00 MDepreciation and amortization expensesDepreciation andamortization expenses$52.00 MOther expensesOther expenses$32.00 M
Chart details

Hilton Worldwide Holdings Inc. (HLT) FY2026 Q3 P&L / Income Statement

Income statement for 2026-07-01 through 2026-09-30. View: Business segment. Revenue uses this breakdown; costs and expenses retain the consolidated categories.

Total revenues
3,325,000,000 US dollars
Total expenses
2,416,000,000 US dollars
Operating income
909,000,000 US dollars
Other income (expense), net (calculated)
negative 187,000,000 US dollars
Income before income taxes
722,000,000 US dollars
Income tax expense
186,000,000 US dollars
Net income
536,000,000 US dollars
Management and Franchise
1,012,000,000 US dollars
Ownership revenue
304,000,000 US dollars
Undisclosed (calculated)
2,009,000,000 US dollars
General and administrative
110,000,000 US dollars
Other expenses
32,000,000 US dollars
Ownership expense
271,000,000 US dollars
Depreciation and amortization expenses
52,000,000 US dollars
Reimbursed expenses
1,951,000,000 US dollars

Chart connections

  • Revenue minus operating expenses equals operating income.
  • Operating income plus other income or expense equals income before tax. Income before tax less income tax expense or benefit equals net income.
Hilton Worldwide Holdings Inc. (HLT) FY2026 Q3 Revenue by Business Segment Sankey chart
Free to share unchanged, with credit to Plicit.ai · CC BY-NC-ND 4.0Download PNG

Intelligent Insights for Investors

Which of Hilton's businesses brings in the most sales?

Management and Franchise leads, with $1.01 B this quarter, or 30% of the total. Ownership is next.

How much does Hilton depend on the biggest piece of its sales by business?

Heavily: the two parts shown here bring in $1.32 B, and Management and Franchise brought in 77% of that this quarter. Ownership, the next largest, brought in the other 23%.

Which parts of Hilton's sales by business drove the change over the past year?

Management and Franchise more than any other part: it added $84.00 M of the $205.00 M rise in revenue from a year earlier. Ownership moved the other way.

How has the mix of Hilton's sales by business shifted over the past year?

Toward Management and Franchise: it made up 30.4% of revenue this quarter, against 29.7% a year earlier. Ownership lost the most share.

Intelligent Insights for Suppliers

Which part of Hilton's sales by business lost the most ground over the past year?

Ownership: its revenue fell 5.6% from a year earlier. Revenue as a whole rose 6.6% over the same span.

Product waitlist

Health Check and Teardown for your own company

A health check uncovers insights of your private books, not a public ticker. Join this list to get notified as soon as we go-live!