
INTERACTIVE BROKERS GROUP, INC. (IBKR) FY2025 Annual Balance Sheet
As of 2025-12-31
Balance Sheet
As of 2025-12-31
Swipe to see the full flow
Chart details
INTERACTIVE BROKERS GROUP, INC. (IBKR) FY2025 Annual Balance Sheet
Balance sheet as of 2025-12-31. The chart shows assets, liabilities and equity at that date.
- Assets
- 203,240,000,000 US dollars
- Liabilities
- 182,768,000,000 US dollars
- Equity
- 20,472,000,000 US dollars
- Noncontrolling interest
- 15,109,000,000 US dollars. Included in consolidated equity; this amount is not added again.
- Customers, less allowance for credit losses of $24 and $25 as of December 31, 2025 and December 31, 2024
- 90,475,000,000 US dollars
- Cash segregated for regulatory purposes
- 50,332,000,000 US dollars
- Securities - segregated for regulatory purposes
- 26,521,000,000 US dollars
- Securities borrowed
- 11,589,000,000 US dollars
- Securities purchased under agreements to resell
- 7,117,000,000 US dollars
- Brokers, dealers, and clearing organizations
- 5,161,000,000 US dollars
- Financial instruments owned, at fair value
- 4,982,000,000 US dollars
- Cash and cash equivalents
- 4,963,000,000 US dollars
- Other assets
- 1,570,000,000 US dollars
- Interest
- 530,000,000 US dollars
- Customers
- 154,336,000,000 US dollars
- Securities loaned
- 24,751,000,000 US dollars
- Brokers, dealers and clearing organizations
- 1,566,000,000 US dollars
- Accounts payable, accrued expenses and other liabilities
- 818,000,000 US dollars
- Financial instruments sold, not yet purchased, at fair value
- 740,000,000 US dollars
- Interest
- 321,000,000 US dollars
- Affiliate
- 217,000,000 US dollars
- Short-term borrowings
- 19,000,000 US dollars
- Retained earnings
- 3,365,000,000 US dollars
- Additional paid-in capital
- 1,957,000,000 US dollars
- Accumulated other comprehensive income, net of income taxes of $0 as of both December 31, 2025 and December 31, 2024
- 56,000,000 US dollars
- Common stock, $0.01 par value per share - Common Class A
- 1,000,000 US dollars
- Common stock, $0.01 par value per share - Common Class B
- 0 US dollars
- Noncontrolling interests
- 15,109,000,000 US dollars
- Treasury stock, at cost, 716,889 and 625,784 shares as of December 31, 2025 and December 31, 2024
- negative 16,000,000 US dollars
- Gross equity (calculated)
- 20,488,000,000 US dollars. Net equity plus the magnitudes of its negative contributions equals gross positive equity. The negative contributions enter this reconciliation as add-backs; their filed signs stay negative.
Chart connections
- Assets equal liabilities plus consolidated equity. Consolidated equity includes noncontrolling interests when reported.
- Treasury shares and other negative equity contributions reduce equity.
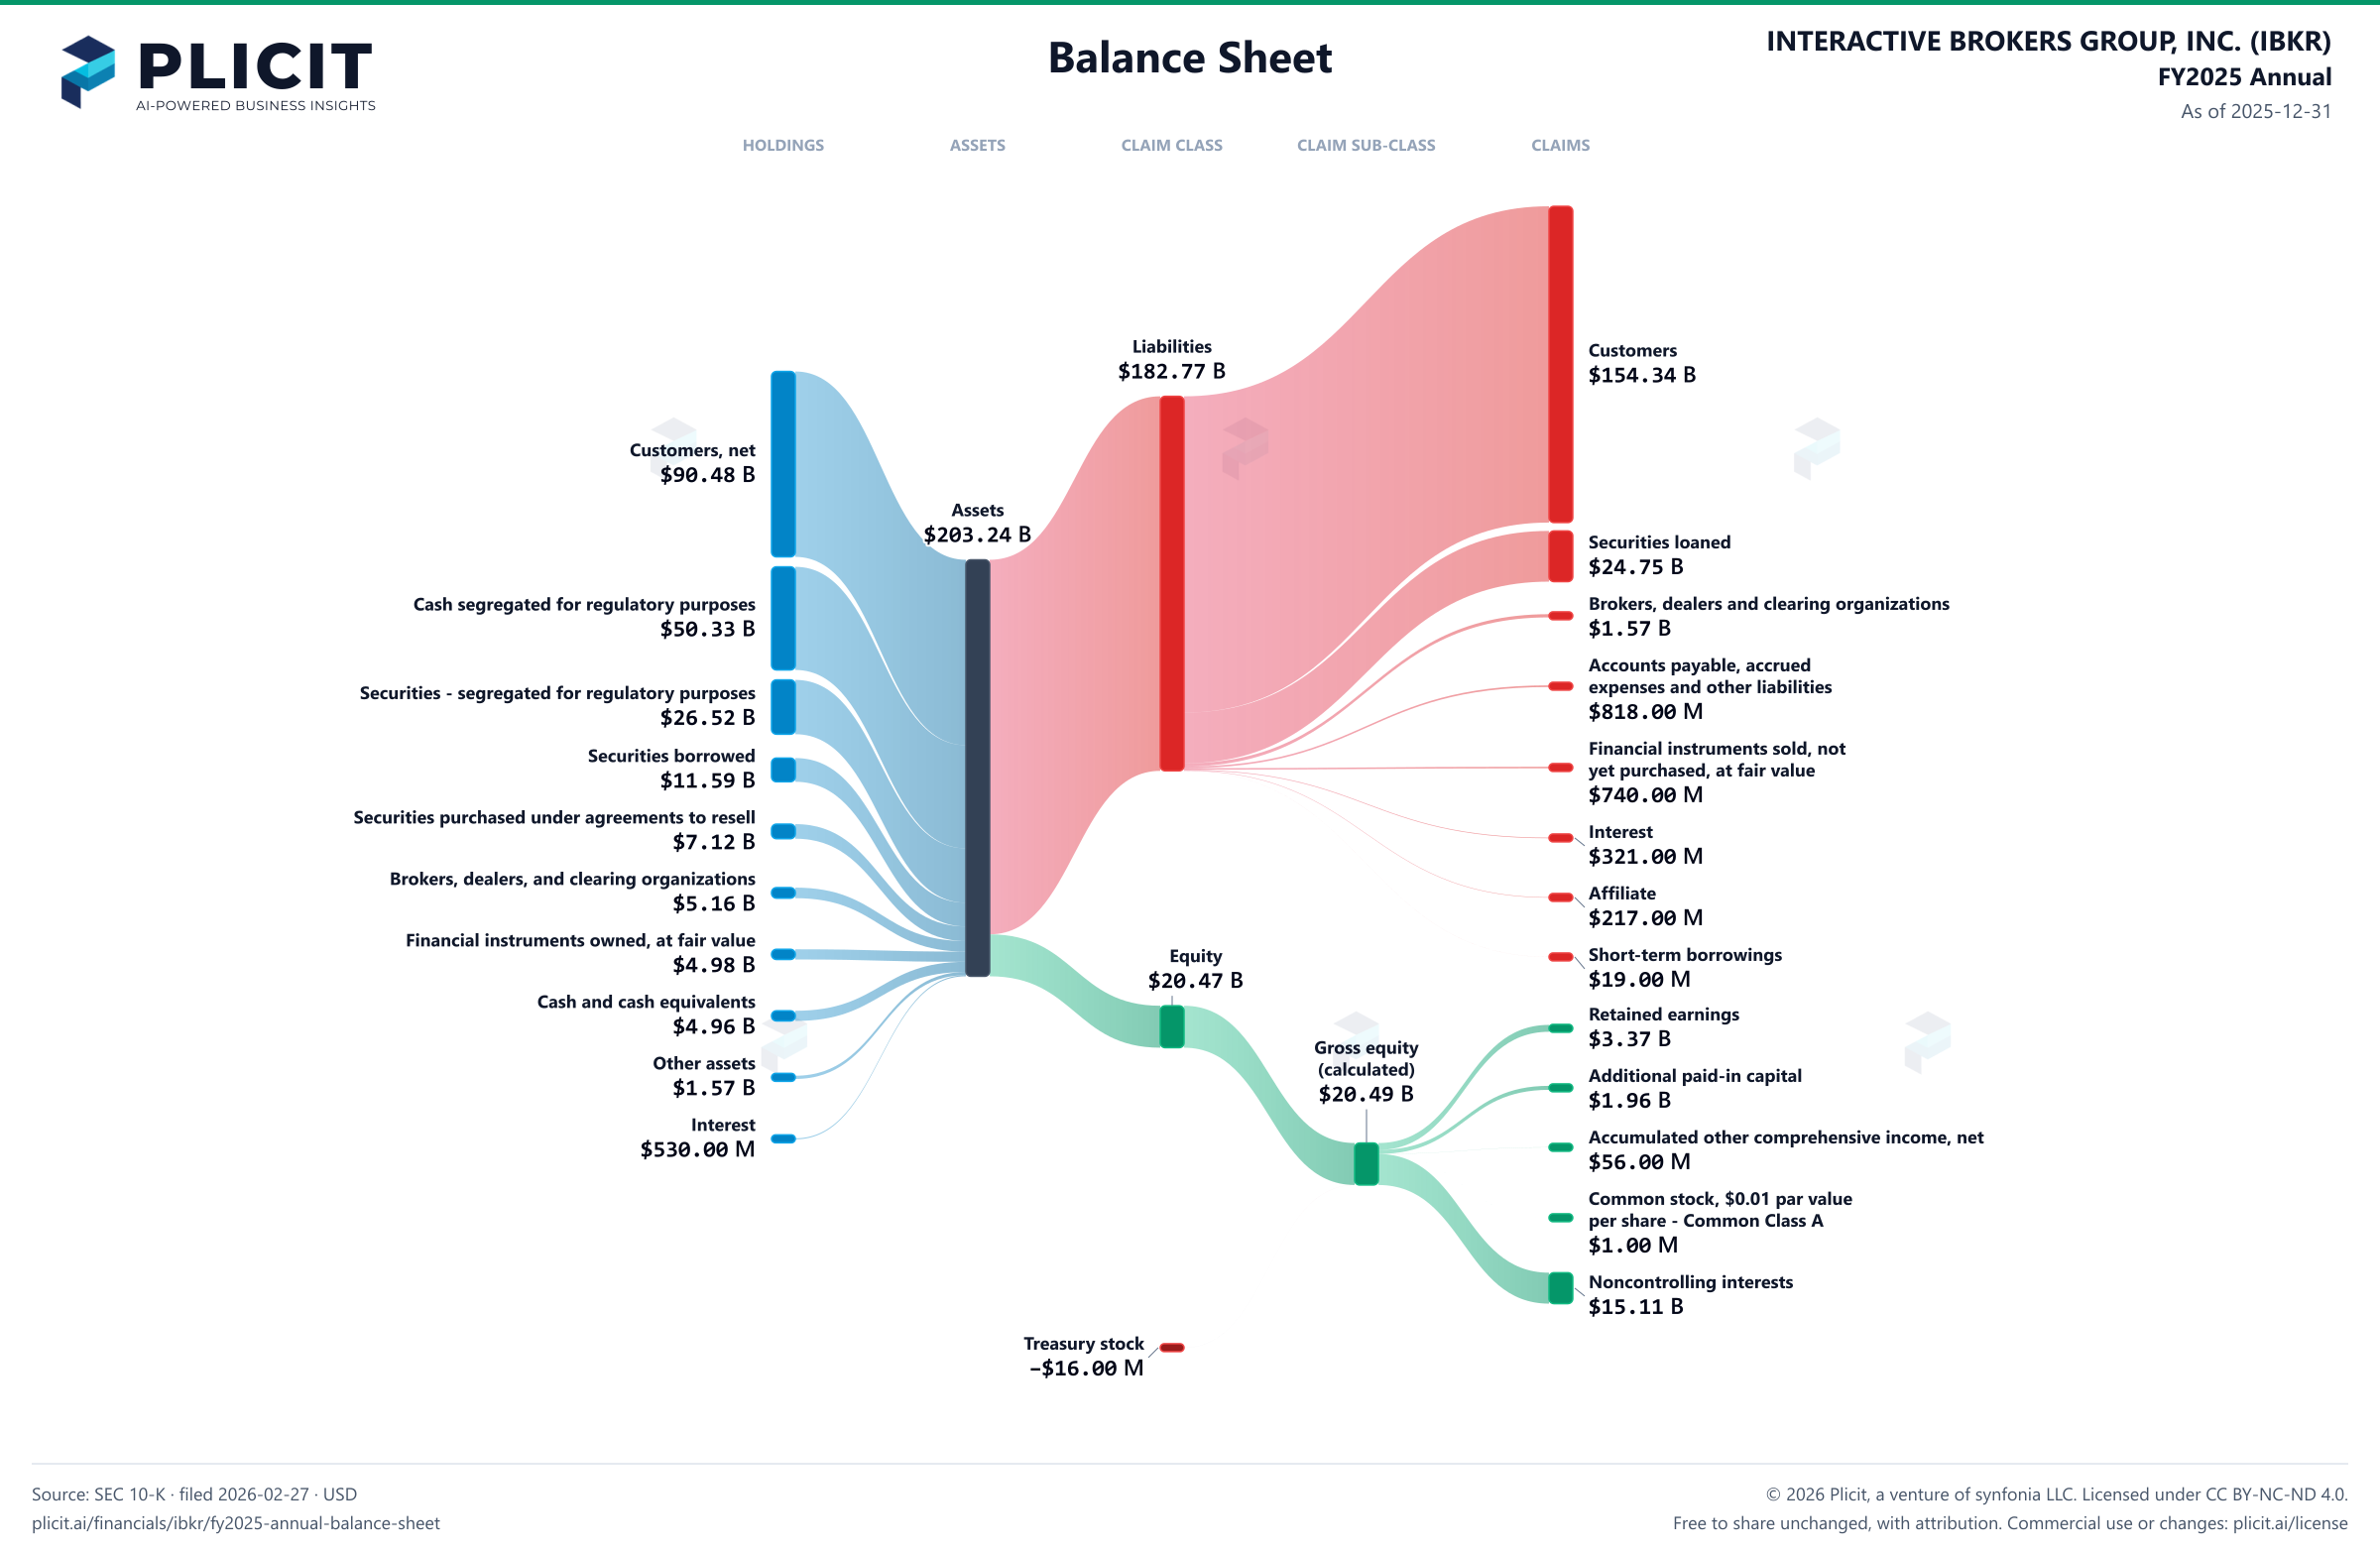
Free to share unchanged, with credit to Plicit.ai · CC BY-NC-ND 4.0Download PNG
Product waitlist
Health Check and Teardown for your own company
A health check uncovers insights of your private books, not a public ticker. Join this list to get notified as soon as we go-live!