
IMAX Corporation (IMAX) FY2026 Q2 Balance Sheet

Balance Sheet

As of 2026-06-30

Swipe to see the full flow
IMAX Corporation (IMAX) FY2026 Q2 Balance SheetBalance sheet as of 2026-06-30. The chart shows assets, liabilities and equity at that date.Liabilities$467.47 MAssets$917.90 MEquity$449.72 MGross equity(calculated)$687.59 MNon-controlling interests$715.00 KHOLDINGSASSETSCLAIM CLASSCLAIM SUB-CLASSCLAIMSProperty, plant and equipment, net of accumulated depreciationCash and cash equivalentsFinancing receivables, net of allowance for credit lossesAccounts receivable, net of allowance for credit lossesVariable consideration receivables, net of allowance for credit lossesGoodwillInventoriesOther intangible assets, net of accumulated amortizationLease incentives and other assetsFilm assets, net of accumulated amortizationPrepaid expensesDeferred income tax assets, net of valuation allowanceConvertible notes and other borrowings, net of unamortized discounts and debt issuance costsAccrued and other liabilitiesDeferred revenueRevolving credit facility borrowings, net of unamortized debt issuance costsAccounts payableDeferred income tax liabilitiesCapital stock common shares — no par value. Authorized — Unlimited number. 54,842,114 issued and outstanding (December 31, 2025 — 53,921,676 issued and outstanding)Other equityStatutory surplus reserveNon-controlling interestsAssetsLiabilitiesEquityGross equity (calculated)Accumulated deficitAccumulated other comprehensive lossNon-controlling interestsLiabilitiesLiabilities$467.47 MConvertible notes and other borrowings, net of unamortized discounts and debt issuance costsConvertible notes and other borrowings, net$243.80 MProperty, plant and equipment, net of accumulated depreciationProperty, plant and equipment, net$238.95 MAccrued and other liabilitiesAccrued and other liabilities$96.55 MCash and cash equivalentsCash and cash equivalents$159.92 MAssetsAssets$917.90 MDeferred revenueDeferred revenue$53.24 MFinancing receivables, net of allowance for credit lossesFinancing receivables, net$118.40 MRevolving credit facility borrowings, net of unamortized debt issuance costsRevolving credit facility borrowings, net$38.84 MAccounts receivable, net of allowance for credit lossesAccounts receivable, net of allowance for credit losses$114.56 MAccounts payableAccounts payable$22.51 MEquityEquity$449.72 MVariable consideration receivables, net of allowance for credit lossesVariable consideration receivables, net$97.46 MDeferred income tax liabilitiesDeferred income tax liabilities$12.52 MGross equity (calculated)Gross equity(calculated)$687.59 MGoodwillGoodwill$45.82 MInventoriesInventories$39.25 MCapital stock common shares — no par value. Authorized — Unlimited number. 54,842,114 issued and outstanding (December 31, 2025 — 53,921,676 issued and outstanding)Capital stock common shares — no par value. Authorized$441.34 MOther intangible assets, net of accumulated amortizationOther intangible assets, net$29.74 MNon-controlling interestsNon-controlling interests$715.00 KLease incentives and other assetsLease incentives and other assets$28.61 MOther equityOther equity$148.20 MFilm assets, net of accumulated amortizationFilm assets, net of accumulated amortization$18.40 MPrepaid expensesPrepaid expenses$14.33 MStatutory surplus reserveStatutory surplus reserve$4.22 MNon-controlling interestsNon-controlling interests$93.83 MDeferred income tax assets, net of valuation allowanceDeferred income tax assets, net of valuation allowance$12.47 MAccumulated deficitAccumulated deficit−$230.82 MAccumulated other comprehensive lossAccumulated other comprehensive loss−$7.05 M
Chart details

IMAX Corporation (IMAX) FY2026 Q2 Balance Sheet

Balance sheet as of 2026-06-30. The chart shows assets, liabilities and equity at that date.

Assets
917,897,000 US dollars
Liabilities
467,465,000 US dollars
Equity
449,717,000 US dollars
Non-controlling interests
715,000 US dollars
Noncontrolling interest
93,828,000 US dollars. Included in consolidated equity; this amount is not added again.
Property, plant and equipment, net of accumulated depreciation
238,950,000 US dollars
Cash and cash equivalents
159,917,000 US dollars
Financing receivables, net of allowance for credit losses
118,396,000 US dollars
Accounts receivable, net of allowance for credit losses
114,561,000 US dollars
Variable consideration receivables, net of allowance for credit losses
97,461,000 US dollars
Goodwill
45,815,000 US dollars
Inventories
39,245,000 US dollars
Other intangible assets, net of accumulated amortization
29,740,000 US dollars
Lease incentives and other assets
28,613,000 US dollars
Film assets, net of accumulated amortization
18,401,000 US dollars
Prepaid expenses
14,333,000 US dollars
Deferred income tax assets, net of valuation allowance
12,465,000 US dollars
Convertible notes and other borrowings, net of unamortized discounts and debt issuance costs
243,800,000 US dollars
Accrued and other liabilities
96,554,000 US dollars
Deferred revenue
53,242,000 US dollars
Revolving credit facility borrowings, net of unamortized debt issuance costs
38,837,000 US dollars
Accounts payable
22,511,000 US dollars
Deferred income tax liabilities
12,521,000 US dollars
Capital stock common shares — no par value. Authorized — Unlimited number. 54,842,114 issued and outstanding (December 31, 2025 — 53,921,676 issued and outstanding)
441,338,000 US dollars
Other equity
148,201,000 US dollars
Statutory surplus reserve
4,219,000 US dollars
Non-controlling interests
93,828,000 US dollars
Accumulated deficit
negative 230,817,000 US dollars
Accumulated other comprehensive loss
negative 7,052,000 US dollars
Gross equity (calculated)
687,586,000 US dollars. Net equity plus the magnitudes of its negative contributions equals gross positive equity. The negative contributions enter this reconciliation as add-backs; their filed signs stay negative.

Chart connections

  • Assets equal liabilities plus temporary equity plus consolidated equity. Consolidated equity includes noncontrolling interests when reported.
  • Treasury shares and other negative equity contributions reduce equity.
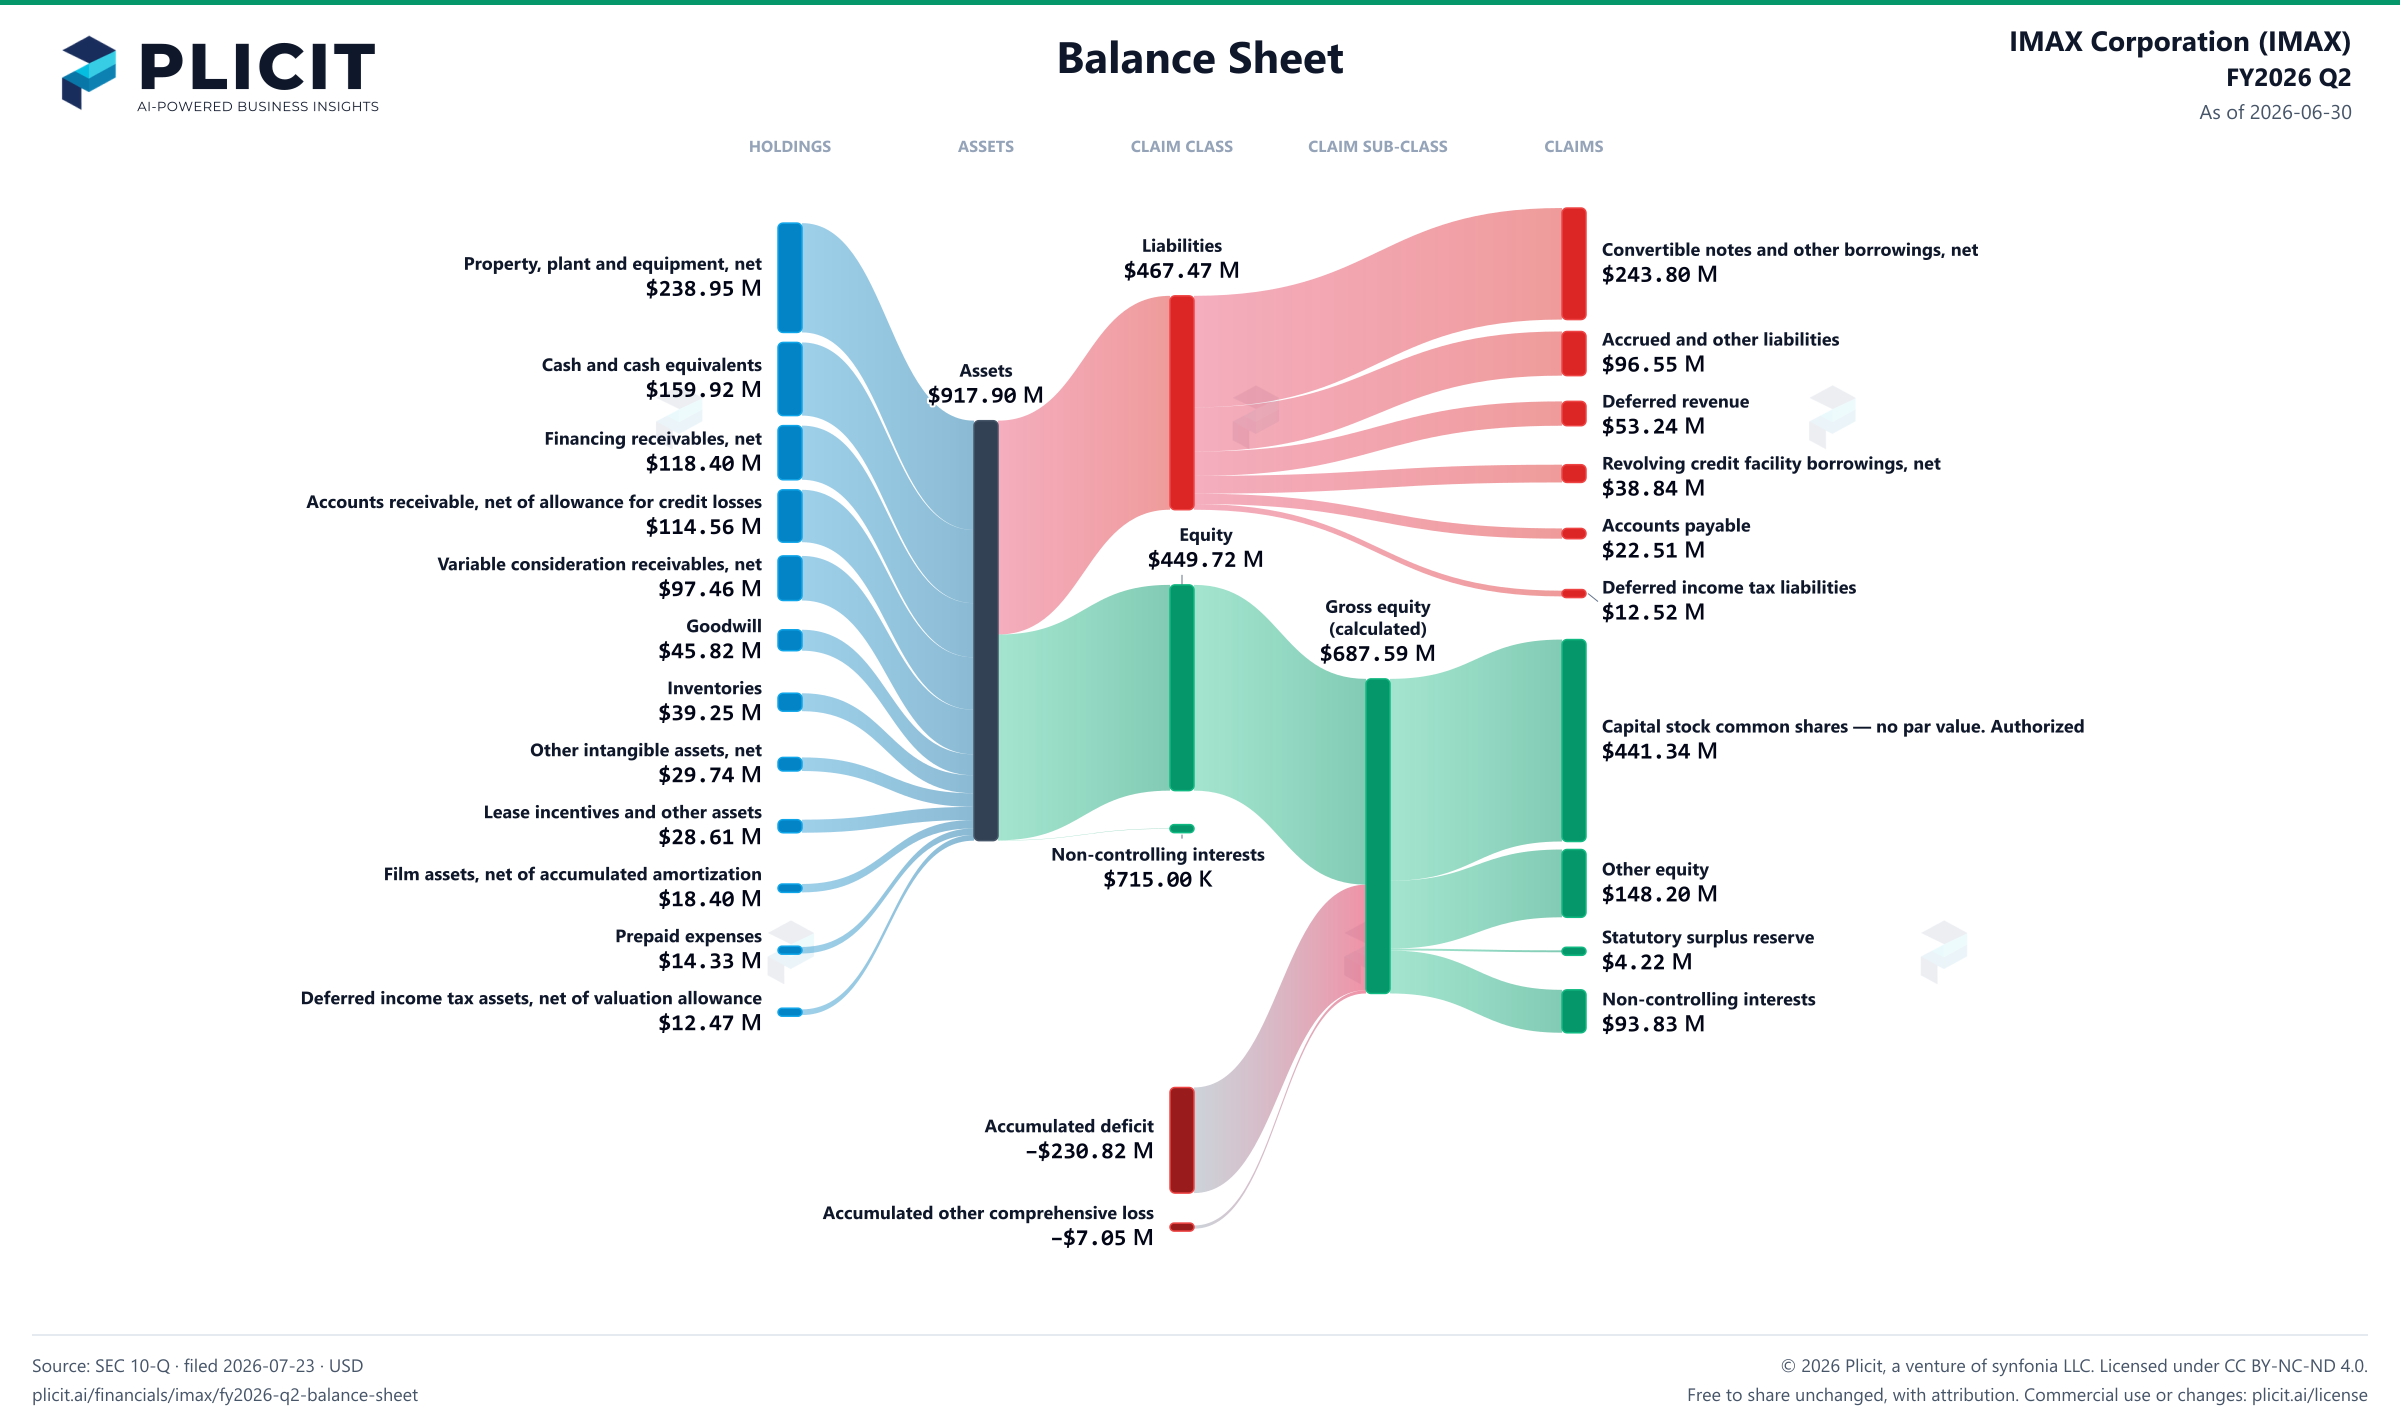
IMAX Corporation (IMAX) FY2026 Q2 Balance Sheet Sankey chart
Free to share unchanged, with credit to Plicit.ai · CC BY-NC-ND 4.0Download PNG

Newsletter

Get the teardowns by email

Subscribe if you want the public-company teardowns in your inbox when they're released.

Product waitlist

Health Check and Teardown for your own company

A health check uncovers insights of your private books, not a public ticker. Join this list to get notified as soon as we go-live!