
InnovAge Holding Corp. (INNV) FY2026 Annual Balance Sheet

Balance Sheet

As of 2026-06-30

Swipe to see the full flow
InnovAge Holding Corp. (INNV) FY2026 Annual Balance SheetBalance sheet as of 2026-06-30. The chart shows assets, liabilities and equity at that date.Current liabilities$203.89 MLiabilities$288.62 MCurrent assets$214.31 MAssets$557.39 MNon-current liabilities$84.73 MNon-current assets$343.08 MEquity$238.76 MGross equity(calculated)$352.02 MRedeemable Noncontrolling Interest (See Note 4)$30.01 MHOLDINGSASSET CLASSASSETSCLAIM CLASSCLAIM SUB-CLASSCLAIMSCash and cash equivalentsShort-term investmentsAccounts receivablePrepaid expenses and otherIncome tax receivableRestricted cashProperty and equipment, netGoodwillOperating lease assetsDeposits and otherOther intangible assets, netAccounts payable and accrued expensesReported and estimated claimsDue to Medicaid and MedicareCurrent portion of finance lease obligationsCurrent portion of operating lease obligationsCurrent portion of long-term debtLong-term debt, net of debt issuance costsOperating lease obligationsDeferred tax liability, netFinance lease obligationsOther noncurrent liabilitiesAdditional paid-in capitalCommon stock, $0.001 par value; 500,000,000 authorized as of each of June 30, 2026 and 2025; 137,483,028 issued and 136,020,049 outstanding as of June 30, 2026 and 136,903,271 issued and 135,440,292 outstanding as of June 30, 2025.Noncontrolling interestsCurrent assetsNon-current assetsAssetsCurrent liabilitiesNon-current liabilitiesLiabilitiesEquityGross equity (calculated)Retained deficitTreasury stock at cost, 1,462,979 and 1,462,979 shares as of June 30, 2026 and June 30, 2025, respectivelyRedeemable Noncontrolling Interest (See Note 4)Accounts payable and accrued expensesAccounts payable and accrued expenses$115.36 MCurrent liabilitiesCurrent liabilities$203.89 MReported and estimated claimsReported and estimated claims$56.86 MCash and cash equivalentsCash and cash equivalents$97.89 MDue to Medicaid and MedicareDue to Medicaid and Medicare$18.27 MLiabilitiesLiabilities$288.62 MCurrent assetsCurrent assets$214.31 MCurrent portion of finance lease obligationsCurrent portion of finance lease obligations$6.28 MShort-term investmentsShort-term investments$43.44 MCurrent portion of operating lease obligationsCurrent portion of operating lease obligations$4.59 MAccounts receivableAccounts receivable$42.39 MAssetsAssets$557.39 MCurrent portion of long-term debtCurrent portion of long-term debt$2.54 MPrepaid expenses and otherPrepaid expenses and other$27.31 MLong-term debt, net of debt issuance costsLong-term debt, net of debt issuance costs$45.52 MIncome tax receivableIncome tax receivable$3.28 MNon-current liabilitiesNon-current liabilities$84.73 MOperating lease obligationsOperating lease obligations$19.78 MRestricted cashRestricted cash$10.00 KDeferred tax liability, netDeferred tax liability, net$9.05 MNon-current assetsNon-current assets$343.08 MEquityEquity$238.76 MProperty and equipment, netProperty and equipment, net$166.09 MFinance lease obligationsFinance lease obligations$8.25 MOther noncurrent liabilitiesOther noncurrent liabilities$2.13 MGross equity (calculated)Gross equity(calculated)$352.02 MGoodwillGoodwill$142.05 MRedeemable Noncontrolling Interest (See Note 4)Redeemable Noncontrolling Interest (See Note 4)$30.01 MOperating lease assetsOperating lease assets$21.41 MAdditional paid-in capitalAdditional paid-in capital$348.72 MDeposits and otherDeposits and other$10.32 MOther intangible assets, netOther intangible assets, net$3.22 MCommon stock, $0.001 par value; 500,000,000 authorized as of each of June 30, 2026 and 2025; 137,483,028 issued and 136,020,049 outstanding as of June 30, 2026 and 136,903,271 issued and 135,440,292 outstanding as of June 30, 2025.Common stock$137.00 KNoncontrolling interestsNoncontrolling interests$3.16 MRetained deficitRetained deficit−$105.76 MTreasury stock at cost, 1,462,979 and 1,462,979 shares as of June 30, 2026 and June 30, 2025, respectivelyTreasury stock at cost−$7.50 M
Chart details

InnovAge Holding Corp. (INNV) FY2026 Annual Balance Sheet

Balance sheet as of 2026-06-30. The chart shows assets, liabilities and equity at that date.

Assets
557,393,000 US dollars
Current assets
214,313,000 US dollars
Non-current assets
343,080,000 US dollars
Liabilities
288,617,000 US dollars
Current liabilities
203,891,000 US dollars
Non-current liabilities
84,726,000 US dollars
Equity
238,763,000 US dollars
Redeemable Noncontrolling Interest (See Note 4)
30,013,000 US dollars
Noncontrolling interest
3,160,000 US dollars. Included in consolidated equity; this amount is not added again.
Cash and cash equivalents
97,891,000 US dollars
Short-term investments
43,435,000 US dollars
Accounts receivable
42,390,000 US dollars
Prepaid expenses and other
27,311,000 US dollars
Income tax receivable
3,276,000 US dollars
Restricted cash
10,000 US dollars
Assets held for sale
0 US dollars
Property and equipment, net
166,086,000 US dollars
Goodwill
142,046,000 US dollars
Operating lease assets
21,412,000 US dollars
Deposits and other
10,318,000 US dollars
Other intangible assets, net
3,218,000 US dollars
Accounts payable and accrued expenses
115,358,000 US dollars
Reported and estimated claims
56,864,000 US dollars
Due to Medicaid and Medicare
18,266,000 US dollars
Current portion of finance lease obligations
6,275,000 US dollars
Current portion of operating lease obligations
4,592,000 US dollars
Current portion of long-term debt
2,536,000 US dollars
Liabilities held for sale
0 US dollars
Long-term debt, net of debt issuance costs
45,521,000 US dollars
Operating lease obligations
19,775,000 US dollars
Deferred tax liability, net
9,051,000 US dollars
Finance lease obligations
8,251,000 US dollars
Other noncurrent liabilities
2,128,000 US dollars
Additional paid-in capital
348,724,000 US dollars
Common stock, $0.001 par value; 500,000,000 authorized as of each of June 30, 2026 and 2025; 137,483,028 issued and 136,020,049 outstanding as of June 30, 2026 and 136,903,271 issued and 135,440,292 outstanding as of June 30, 2025.
137,000 US dollars
Noncontrolling interests
3,160,000 US dollars
Retained deficit
negative 105,758,000 US dollars
Treasury stock at cost, 1,462,979 and 1,462,979 shares as of June 30, 2026 and June 30, 2025, respectively
negative 7,500,000 US dollars
Gross equity (calculated)
352,021,000 US dollars. Net equity plus the magnitudes of its negative contributions equals gross positive equity. The negative contributions enter this reconciliation as add-backs; their filed signs stay negative.

Chart connections

  • Assets equal liabilities plus temporary equity plus consolidated equity. Consolidated equity includes noncontrolling interests when reported.
  • Treasury shares and other negative equity contributions reduce equity.
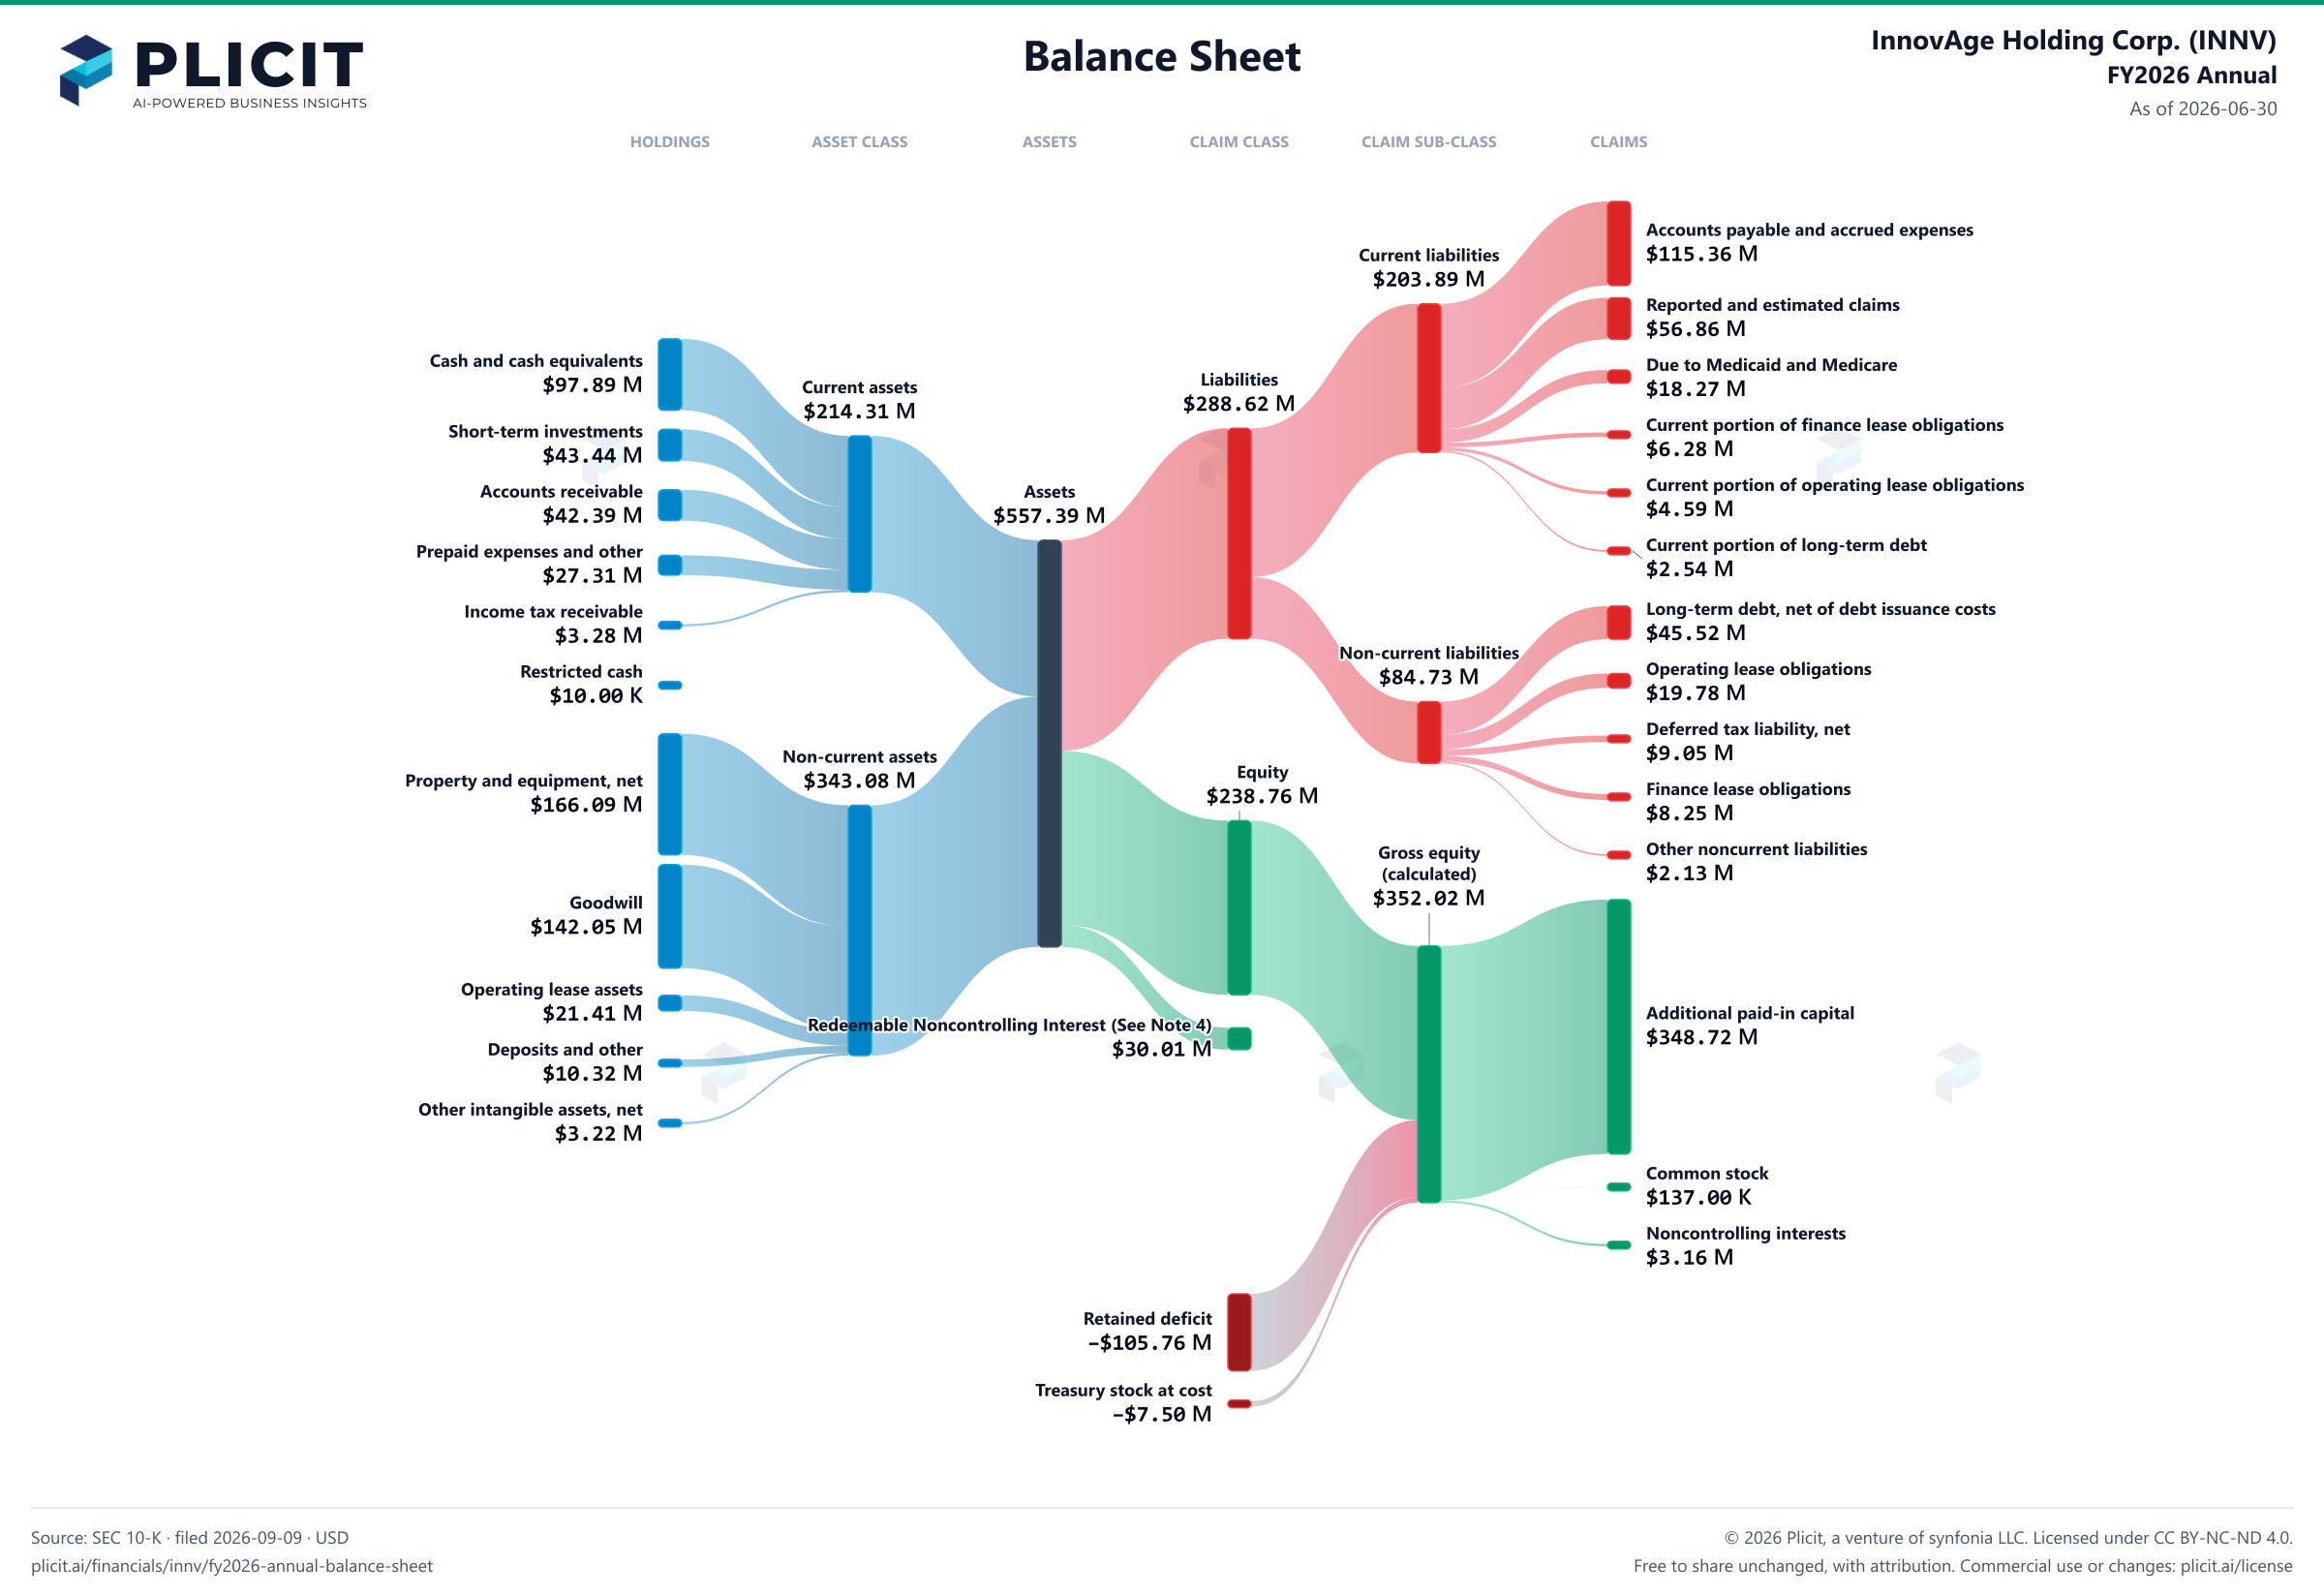
InnovAge Holding Corp. (INNV) FY2026 Annual Balance Sheet Sankey chart
Free to share unchanged, with credit to Plicit.ai · CC BY-NC-ND 4.0Download PNG

Newsletter

Get the teardowns by email

Subscribe if you want the public-company teardowns in your inbox when they're released.

Product waitlist

Health Check and Teardown for your own company

A health check uncovers insights of your private books, not a public ticker. Join this list to get notified as soon as we go-live!