
INTEL CORPORATION (INTC) FY2026 Q2 P&L / Income Statement
2026-03-29 to 2026-06-27
Revenue by Business Segment
2026-03-29 to 2026-06-27
Swipe to see the full flow
Chart details
INTEL CORPORATION (INTC) FY2026 Q2 P&L / Income Statement
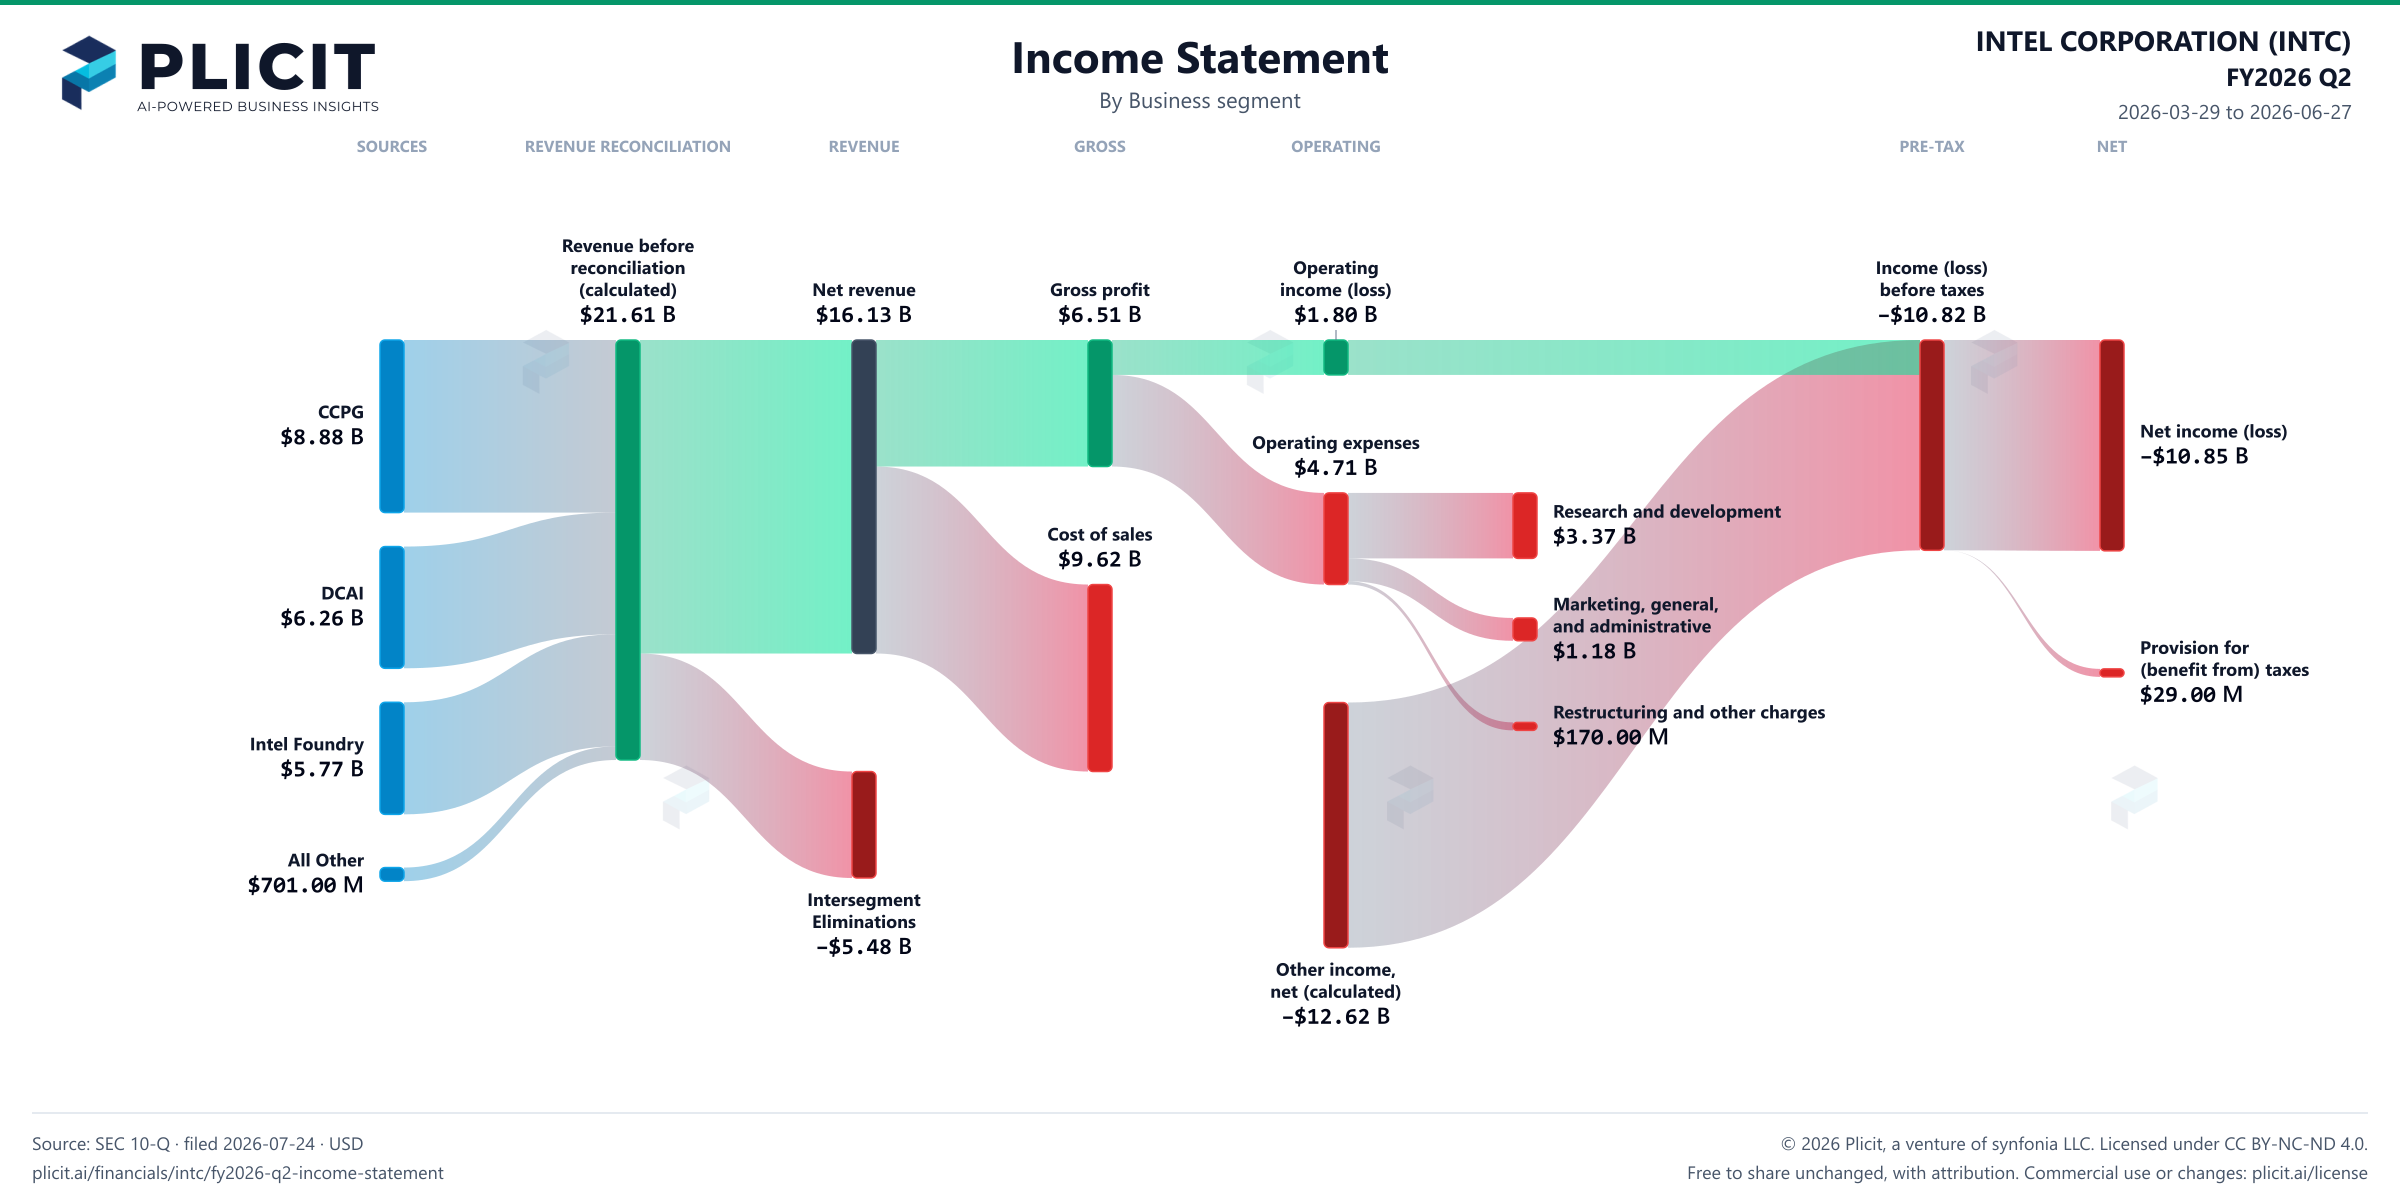
Income statement for 2026-03-29 through 2026-06-27. View: Business segment. Revenue uses this breakdown; costs and expenses retain the consolidated categories.
- Net revenue
- 16,128,000,000 US dollars
- Cost of sales
- 9,619,000,000 US dollars
- Gross profit
- 6,509,000,000 US dollars
- Operating expenses
- 4,713,000,000 US dollars
- Operating income (loss)
- 1,796,000,000 US dollars
- Other income (expense), net (calculated)
- negative 12,615,000,000 US dollars
- Income (loss) before taxes
- negative 10,819,000,000 US dollars
- Provision for (benefit from) taxes
- 29,000,000 US dollars
- Net income (loss)
- negative 10,848,000,000 US dollars
- Client Computing and Physical AI Group
- 8,877,000,000 US dollars
- Datacenter and AI
- 6,262,000,000 US dollars
- Intel Foundry
- 5,765,000,000 US dollars
- All Other
- 701,000,000 US dollars
- Research and development
- 3,368,000,000 US dollars
- Marketing, general, and administrative
- 1,175,000,000 US dollars
- Restructuring and other charges
- 170,000,000 US dollars
- Revenue before reconciliation (calculated)
- 21,605,000,000 US dollars. Sum of the reported revenue categories before the separately reported reconciliation.
- Intersegment Eliminations
- negative 5,477,000,000 US dollars. Reported reconciliation to consolidated revenue.
Chart connections
- Revenue less cost of revenue equals gross profit; gross profit less operating expenses equals operating income.
- Operating income plus other income or expense equals income before tax. Income before tax less income tax expense or benefit equals net income.
- Reported revenue categories plus the separately reported signed reconciliation equals consolidated revenue.
- Of which attributable to INTEL CORPORATION: −$11.03 B; to noncontrolling interests: $185.00 M.
Free to share unchanged, with credit to Plicit.ai · CC BY-NC-ND 4.0Download PNG
Gross margin
40.4%
Gross profit / revenue
Operating margin
11.1%
Operating profit / revenue
Product waitlist
Health Check and Teardown for your own company
A health check uncovers insights of your private books, not a public ticker. Join this list to get notified as soon as we go-live!