
INTUIT INC. (INTU) FY2026 Annual P&L / Income Statement

Revenue by Business Segment by Product and Service

2025-08-01 to 2026-07-31

Swipe to see the full flow
INTUIT INC. (INTU) FY2026 Annual P&L / Income StatementIncome statement for 2025-08-01 through 2026-07-31. View: Segments by Product and Service. Revenue uses this breakdown; costs and expenses retain the consolidated categories.SOURCESREVENUEGROSSOPERATINGPRE-TAXNETConsumer - TurboTaxGlobal Business Solutions - QuickBooks Online AccountingGlobal Business Solutions - Online ServicesConsumer - Credit KarmaGlobal Business Solutions - QuickBooks Desktop AccountingGlobal Business Solutions - Desktop Services and SuppliesConsumer - ProTaxTotal net revenueGross profit (calculated)Total cost of revenue (calculated)Cost of revenueAmortization of acquired technologyOperating incomeOperating expenses (calculated)Selling and marketingResearch and developmentGeneral and administrativeRestructuringAmortization of other acquired intangible assetsOther income (expense), net (calculated)Income before income taxesNet incomeIncome tax provisionOther income (expense), net (calculated)Other income,net (calculated)$133.00 MGross profit (calculated)Gross profit(calculated)$17.20 BIncome before income taxesPretax income$6.02 BTotal net revenueTotal net revenue$21.45 BOperating incomeOperating income$5.88 BNet incomeNet income$4.57 BConsumer - TurboTaxConsumer - TurboTax$5.30 BOperating expenses (calculated)Operating expenses(calculated)$11.31 BGlobal Business Solutions - QuickBooks Online AccountingGlobal Business Solutions -QuickBooks Online Accounting$5.05 BIncome tax provisionIncome taxes$1.45 BSelling and marketingSelling and marketing$5.53 BGlobal Business Solutions - Online ServicesGlobal Business Solutions- Online Services$4.87 BTotal cost of revenue (calculated)Total cost of revenue(calculated)$4.25 BResearch and developmentResearch and development$3.38 BConsumer - Credit KarmaConsumer - Credit Karma$2.64 BGeneral and administrativeGeneral and administrative$1.62 BGlobal Business Solutions - QuickBooks Desktop AccountingGlobal Business Solutions -QuickBooks Desktop Accounting$1.80 BRestructuringRestructuring$293.00 MCost of revenueCost of revenue$4.08 BGlobal Business Solutions - Desktop Services and SuppliesGlobal Business Solutions -Desktop Services and Supplies$1.15 BAmortization of acquired technologyAmortization ofacquired technology$174.00 MAmortization of other acquired intangible assetsAmortization of otheracquired intangible assets$485.00 MConsumer - ProTaxConsumer - ProTax$647.00 M
Chart details

INTUIT INC. (INTU) FY2026 Annual P&L / Income Statement

Income statement for 2025-08-01 through 2026-07-31. View: Segments by Product and Service. Revenue uses this breakdown; costs and expenses retain the consolidated categories.

Total net revenue
21,448,000,000 US dollars
Total cost of revenue (calculated)
4,253,000,000 US dollars
Gross profit (calculated)
17,195,000,000 US dollars
Operating expenses (calculated)
11,311,000,000 US dollars
Operating income
5,884,000,000 US dollars
Other income (expense), net (calculated)
133,000,000 US dollars
Income before income taxes
6,017,000,000 US dollars
Income tax provision
1,451,000,000 US dollars
Net income
4,566,000,000 US dollars
Consumer - Credit Karma
2,641,000,000 US dollars
Consumer - ProTax
647,000,000 US dollars
Consumer - TurboTax
5,296,000,000 US dollars
Global Business Solutions - Desktop Services and Supplies
1,145,000,000 US dollars
Global Business Solutions - Online Services
4,867,000,000 US dollars
Global Business Solutions - QuickBooks Desktop Accounting
1,801,000,000 US dollars
Global Business Solutions - QuickBooks Online Accounting
5,051,000,000 US dollars
Cost of revenue
4,079,000,000 US dollars
Amortization of acquired technology
174,000,000 US dollars
General and administrative
1,623,000,000 US dollars
Restructuring
293,000,000 US dollars
Research and development
3,376,000,000 US dollars
Amortization of other acquired intangible assets
485,000,000 US dollars
Selling and marketing
5,534,000,000 US dollars

Chart connections

  • Revenue less cost of revenue equals gross profit; gross profit less operating expenses equals operating income.
  • Operating income plus other income or expense equals income before tax. Income before tax less income tax expense or benefit equals net income.
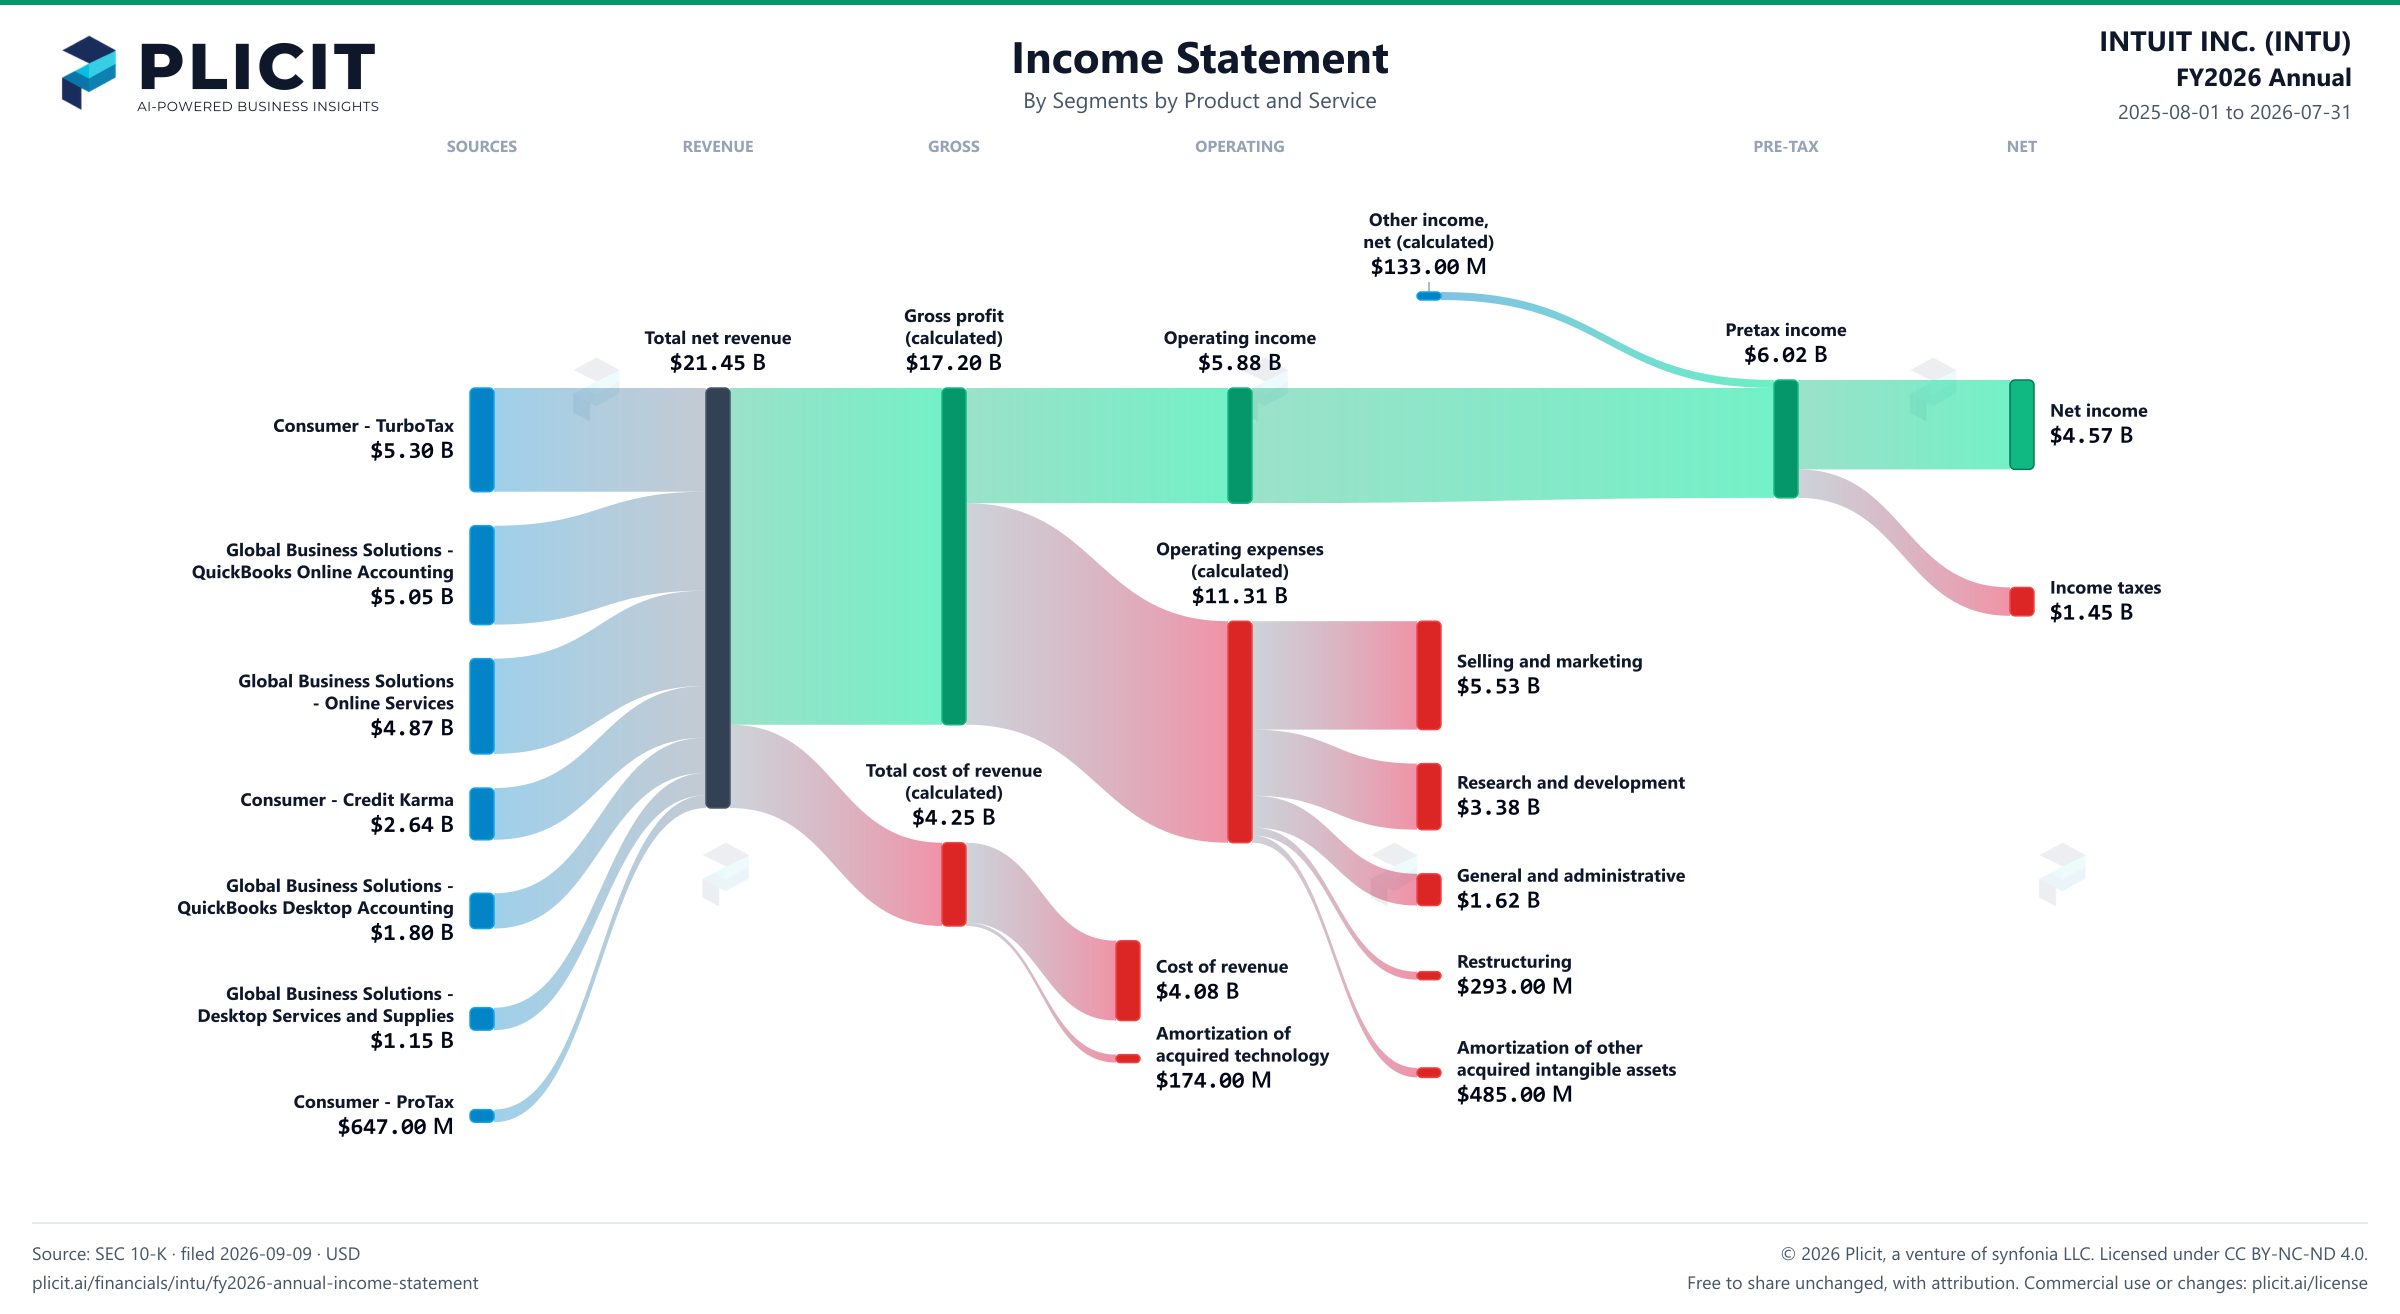
INTUIT INC. (INTU) FY2026 Annual Revenue by Business Segment by Product and Service Sankey chart
Free to share unchanged, with credit to Plicit.ai · CC BY-NC-ND 4.0Download PNG

Gross margin

80.2%

Gross profit / revenue

Operating margin

27.4%

Operating profit / revenue

Cash conversion

193.6%

Operating cash / net income, same period

Newsletter

Get the teardowns by email

Subscribe if you want the public-company teardowns in your inbox when they're released.

Product waitlist

Health Check and Teardown for your own company

A health check uncovers insights of your private books, not a public ticker. Join this list to get notified as soon as we go-live!