
INNOSPEC INC. (IOSP) FY2026 Q2 Balance Sheet

Balance Sheet

As of 2026-06-30

Swipe to see the full flow
INNOSPEC INC. (IOSP) FY2026 Q2 Balance SheetBalance sheet as of 2026-06-30. The chart shows assets, liabilities and equity at that date.Current liabilities$368.10 MCurrent assets$1.02 BLiabilities$495.20 MAssets$1.85 BNon-current liabilities$127.10 MEquity$1.35 BNon-current assets$821.50 MGross equity(calculated)$1.52 BHOLDINGSASSET CLASSASSETSCLAIM CLASSCLAIM SUB-CLASSCLAIMSTrade and other accounts receivable (less allowances of $15.4 million and $11.8 million respectively)Cash and cash equivalentsFinished goodsRaw materialsPrepaid expensesOther current assetsPrepaid income taxesGoodwillNet property, plant and equipmentOther intangible assetsOperating lease right-of-use assetsDeferred tax assetsOther non-current assetsAccrued liabilitiesAccounts payableCurrent portion of operating lease liabilitiesAccrued income taxesCurrent portion of plant closure provisionsCurrent portion of acquisition-related contingent considerationPlant closure provisions, net of current portionOperating lease liabilities, net of current portionDeferred tax liabilitiesPension liabilities and post-employment benefitsOther non-current liabilitiesAcquisition-related contingent considerationRetained earningsAdditional paid-in capitalCommon stock, $0.01 par value, authorized 40,000,000 shares, issued 29,554,500sharesNon-controlling interestCurrent assetsNon-current assetsAssetsCurrent liabilitiesNon-current liabilitiesLiabilitiesEquityGross equity (calculated)Treasury stock (4,923,453 and 4,776,918 shares at cost, respectively)Accumulated other comprehensive lossAccrued liabilitiesAccrued liabilities$170.00 MAccounts payableAccounts payable$169.40 MCurrent liabilitiesCurrent liabilities$368.10 MCurrent portion of operating lease liabilitiesCurrent portion of operating lease liabilities$14.30 MAccrued income taxesAccrued income taxes$6.70 MTrade and other accounts receivable (less allowances of $15.4 million and $11.8 million respectively)Trade and other accounts receivable$408.60 MCurrent assetsCurrent assets$1.02 BCurrent portion of plant closure provisionsCurrent portion of plant closure provisions$4.90 MLiabilitiesLiabilities$495.20 MCash and cash equivalentsCash and cash equivalents$250.20 MCurrent portion of acquisition-related contingent considerationCurrent portion of acquisition-relatedcontingent consideration$2.80 MFinished goodsFinished goods$235.00 MAssetsAssets$1.85 BPlant closure provisions, net of current portionPlant closure provisions, net of current portion$59.80 MRaw materialsRaw materials$102.30 MOperating lease liabilities, net of current portionOperating lease liabilities, net of current portion$33.60 MPrepaid expensesPrepaid expenses$13.30 MNon-current liabilitiesNon-current liabilities$127.10 MDeferred tax liabilitiesDeferred tax liabilities$16.00 MOther current assetsOther current assets$9.60 MEquityEquity$1.35 BPension liabilities and post-employment benefitsPension liabilities and post-employment benefits$12.70 MPrepaid income taxesPrepaid income taxes$5.70 MOther non-current liabilitiesOther non-current liabilities$3.70 MGoodwillGoodwill$398.20 MAcquisition-related contingent considerationAcquisition-related contingent consideration$1.30 MNon-current assetsNon-current assets$821.50 MGross equity (calculated)Gross equity(calculated)$1.52 BNet property, plant and equipmentNet property, plant and equipment$293.30 MOther intangible assetsOther intangible assets$65.30 MRetained earningsRetained earnings$1.14 BOperating lease right-of-use assetsOperating lease right-of-use assets$47.90 MDeferred tax assetsDeferred tax assets$13.30 MOther non-current assetsOther non-current assets$3.50 MAdditional paid-in capitalAdditional paid-in capital$379.10 MCommon stock, $0.01 par value, authorized 40,000,000 shares, issued 29,554,500sharesCommon stock$300.00 KNon-controlling interestNon-controlling interest$7.60 MTreasury stock (4,923,453 and 4,776,918 shares at cost, respectively)Treasury stock−$127.80 MAccumulated other comprehensive lossAccumulated other comprehensive loss−$45.90 M
Chart details

INNOSPEC INC. (IOSP) FY2026 Q2 Balance Sheet

Balance sheet as of 2026-06-30. The chart shows assets, liabilities and equity at that date.

Assets
1,846,200,000 US dollars
Current assets
1,024,700,000 US dollars
Non-current assets
821,500,000 US dollars
Liabilities
495,200,000 US dollars
Current liabilities
368,100,000 US dollars
Non-current liabilities
127,100,000 US dollars
Equity
1,351,000,000 US dollars
Noncontrolling interest
7,600,000 US dollars. Included in consolidated equity; this amount is not added again.
Trade and other accounts receivable (less allowances of $15.4 million and $11.8 million respectively)
408,600,000 US dollars
Cash and cash equivalents
250,200,000 US dollars
Finished goods
235,000,000 US dollars
Raw materials
102,300,000 US dollars
Prepaid expenses
13,300,000 US dollars
Other current assets
9,600,000 US dollars
Prepaid income taxes
5,700,000 US dollars
Goodwill
398,200,000 US dollars
Net property, plant and equipment
293,300,000 US dollars
Other intangible assets
65,300,000 US dollars
Operating lease right-of-use assets
47,900,000 US dollars
Deferred tax assets
13,300,000 US dollars
Other non-current assets
3,500,000 US dollars
Accrued liabilities
170,000,000 US dollars
Accounts payable
169,400,000 US dollars
Current portion of operating lease liabilities
14,300,000 US dollars
Accrued income taxes
6,700,000 US dollars
Current portion of plant closure provisions
4,900,000 US dollars
Current portion of acquisition-related contingent consideration
2,800,000 US dollars
Plant closure provisions, net of current portion
59,800,000 US dollars
Operating lease liabilities, net of current portion
33,600,000 US dollars
Deferred tax liabilities
16,000,000 US dollars
Pension liabilities and post-employment benefits
12,700,000 US dollars
Other non-current liabilities
3,700,000 US dollars
Acquisition-related contingent consideration
1,300,000 US dollars
Retained earnings
1,137,700,000 US dollars
Additional paid-in capital
379,100,000 US dollars
Common stock, $0.01 par value, authorized 40,000,000 shares, issued 29,554,500shares
300,000 US dollars
Non-controlling interest
7,600,000 US dollars
Treasury stock (4,923,453 and 4,776,918 shares at cost, respectively)
negative 127,800,000 US dollars
Accumulated other comprehensive loss
negative 45,900,000 US dollars
Gross equity (calculated)
1,524,700,000 US dollars. Net equity plus the magnitudes of its negative contributions equals gross positive equity. The negative contributions enter this reconciliation as add-backs; their filed signs stay negative.

Chart connections

  • Assets equal liabilities plus consolidated equity. Consolidated equity includes noncontrolling interests when reported.
  • Treasury shares and other negative equity contributions reduce equity.
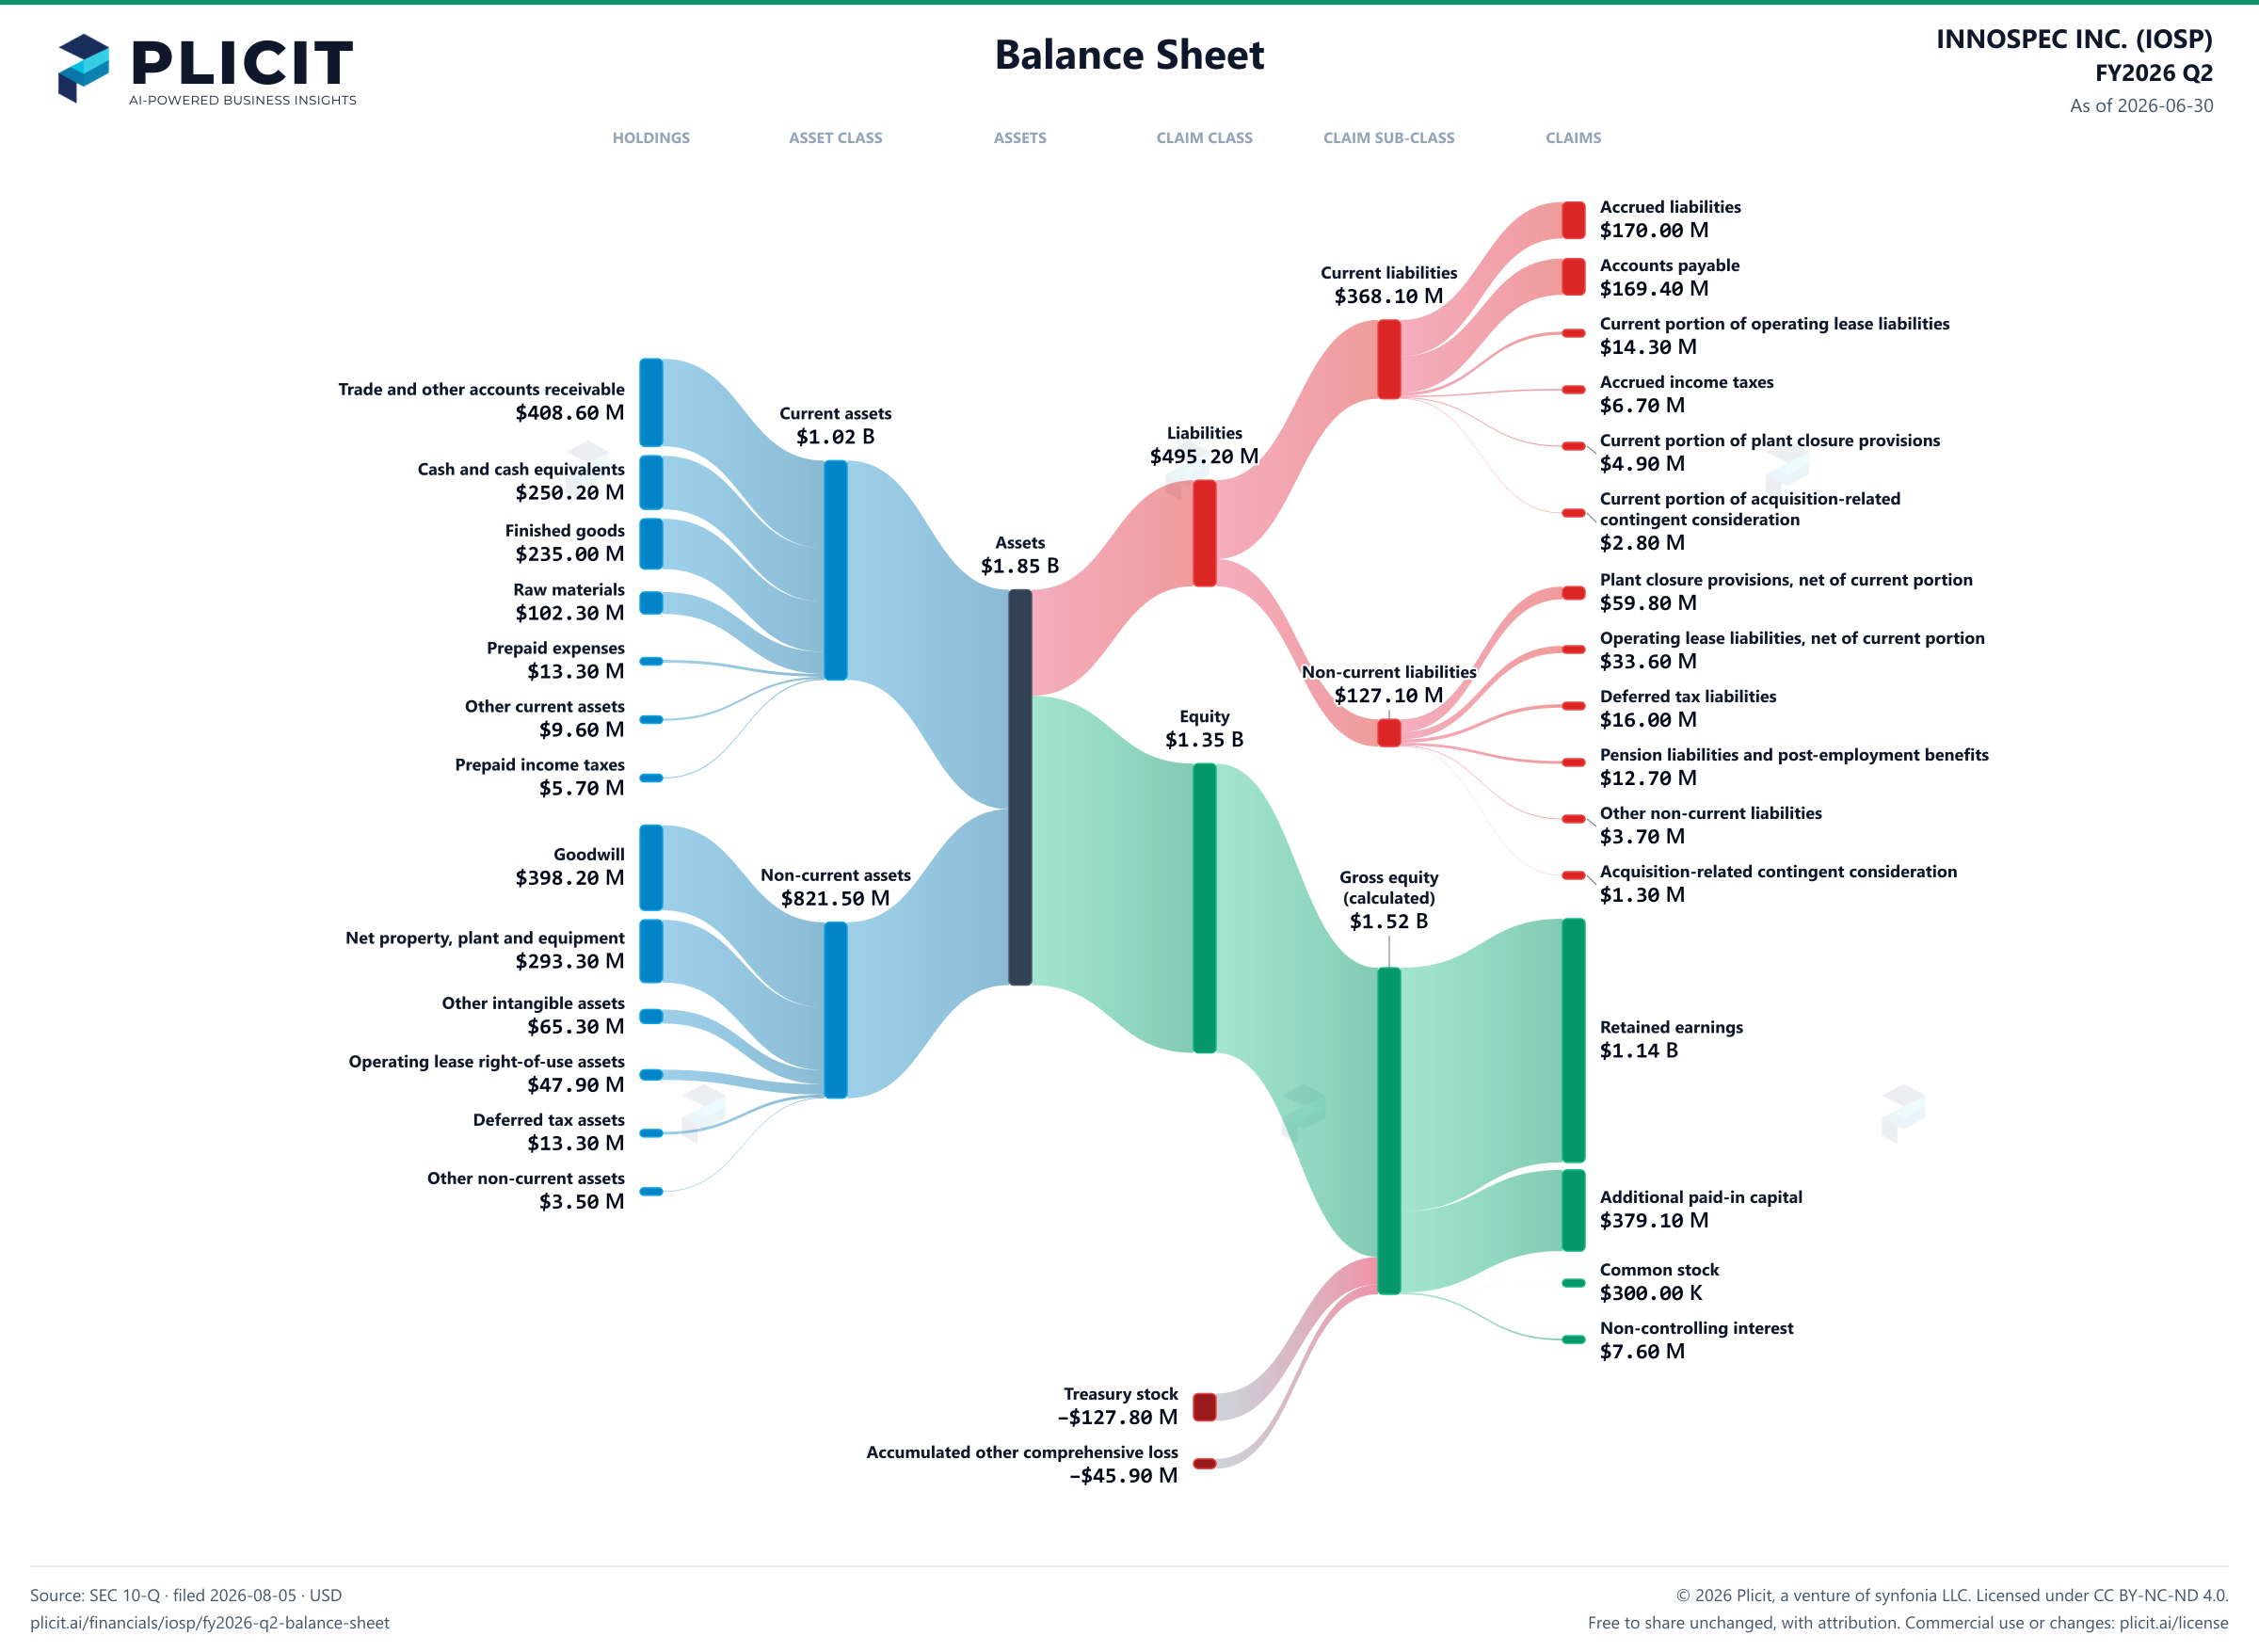
INNOSPEC INC. (IOSP) FY2026 Q2 Balance Sheet Sankey chart
Free to share unchanged, with credit to Plicit.ai · CC BY-NC-ND 4.0Download PNG

Newsletter

Get the teardowns by email

Subscribe if you want the public-company teardowns in your inbox when they're released.

Product waitlist

Health Check and Teardown for your own company

A health check uncovers insights of your private books, not a public ticker. Join this list to get notified as soon as we go-live!