
IQVIA HOLDINGS INC. (IQV) FY2025 Q1 P&L / Income Statement

Revenue by Business Segment by Geography

2025-01-01 to 2025-03-31

Swipe to see the full flow
IQVIA HOLDINGS INC. (IQV) FY2025 Q1 P&L / Income StatementIncome statement for 2025-01-01 through 2025-03-31. View: Segments by Geographical. Revenue uses this breakdown; costs and expenses retain the consolidated categories.SOURCESREVENUEGROSSOPERATINGPRE-TAXNETResearch & Development Solutions - AmericasTechnology & Analytics Solutions - AmericasTechnology & Analytics Solutions - Europe and AfricaResearch & Development Solutions - Asia-PacificResearch & Development Solutions - Europe and AfricaTechnology & Analytics Solutions - Asia-PacificContract Sales & Medical Solutions - AmericasContract Sales & Medical Solutions - Asia-PacificContract Sales & Medical Solutions - Europe and AfricaRevenuesGross profit (calculated)Cost of revenue (calculated)Cost of revenues, exclusive of depreciation and amortizationIncome from operationsOperating expenses (calculated)Selling, general and administrative expensesDepreciation and amortizationRestructuring costsIncome before income taxes and equity in losses of unconsolidated affiliatesOther income (expense), net (calculated)Net incomeIncome tax expenseEquity in losses of unconsolidated affiliatesGross profit (calculated)Gross profit(calculated)$1.30 BRevenuesRevenues$3.83 BIncome from operationsIncome from operations$496.00 MIncome before income taxes and equity in losses of unconsolidated affiliatesPretax income$323.00 MNet incomeNet income$249.00 MResearch & Development Solutions - AmericasResearch & DevelopmentSolutions - Americas$954.00 MOperating expenses (calculated)Operating expenses(calculated)$802.00 MIncome tax expenseIncome tax expense$61.00 MTechnology & Analytics Solutions - AmericasTechnology & AnalyticsSolutions - Americas$783.00 MSelling, general and administrative expensesSelling, general andadministrative expenses$508.00 MCost of revenue (calculated)Cost of revenue(calculated)$2.53 BOther income (expense), net (calculated)Other income,net (calculated)−$173.00 MTechnology & Analytics Solutions - Europe and AfricaTechnology & AnalyticsSolutions - Europe and Africa$617.00 MDepreciation and amortizationDepreciation and amortization$265.00 MEquity in losses of unconsolidated affiliatesEquity in lossesof unconsolidatedaffiliates−$13.00 MRestructuring costsRestructuring costs$29.00 MResearch & Development Solutions - Asia-PacificResearch & DevelopmentSolutions - Asia-Pacific$594.00 MCost of revenues, exclusive of depreciation and amortizationCost of revenues$2.53 BResearch & Development Solutions - Europe and AfricaResearch & DevelopmentSolutions - Europe and Africa$554.00 MTechnology & Analytics Solutions - Asia-PacificTechnology & AnalyticsSolutions - Asia-Pacific$146.00 MContract Sales & Medical Solutions - AmericasContract Sales & MedicalSolutions - Americas$70.00 MContract Sales & Medical Solutions - Asia-PacificContract Sales & MedicalSolutions - Asia-Pacific$58.00 MContract Sales & Medical Solutions - Europe and AfricaContract Sales & MedicalSolutions - Europe and Africa$53.00 M
Chart details

IQVIA HOLDINGS INC. (IQV) FY2025 Q1 P&L / Income Statement

Income statement for 2025-01-01 through 2025-03-31. View: Segments by Geographical. Revenue uses this breakdown; costs and expenses retain the consolidated categories.

Revenues
3,829,000,000 US dollars
Cost of revenue (calculated)
2,531,000,000 US dollars
Gross profit (calculated)
1,298,000,000 US dollars
Operating expenses (calculated)
802,000,000 US dollars
Income from operations
496,000,000 US dollars
Other income (expense), net (calculated)
negative 173,000,000 US dollars
Income before income taxes and equity in losses of unconsolidated affiliates
323,000,000 US dollars
Income tax expense
61,000,000 US dollars
Net income
249,000,000 US dollars
Contract Sales & Medical Solutions - Americas
70,000,000 US dollars
Contract Sales & Medical Solutions - Asia-Pacific
58,000,000 US dollars
Contract Sales & Medical Solutions - Europe and Africa
53,000,000 US dollars
Research & Development Solutions - Americas
954,000,000 US dollars
Research & Development Solutions - Asia-Pacific
594,000,000 US dollars
Research & Development Solutions - Europe and Africa
554,000,000 US dollars
Technology & Analytics Solutions - Americas
783,000,000 US dollars
Technology & Analytics Solutions - Asia-Pacific
146,000,000 US dollars
Technology & Analytics Solutions - Europe and Africa
617,000,000 US dollars
Cost of revenues, exclusive of depreciation and amortization
2,531,000,000 US dollars
Restructuring costs
29,000,000 US dollars
Depreciation and amortization
265,000,000 US dollars
Selling, general and administrative expenses
508,000,000 US dollars
Equity in losses of unconsolidated affiliates
negative 13,000,000 US dollars. Reported below-tax contribution to net income.

Chart connections

  • Revenue less cost of revenue equals gross profit; gross profit less operating expenses equals operating income.
  • Operating income plus other income or expense equals income before tax. Income before tax less income tax expense or benefit, plus the explicitly reported below-tax contributions, equals net income.
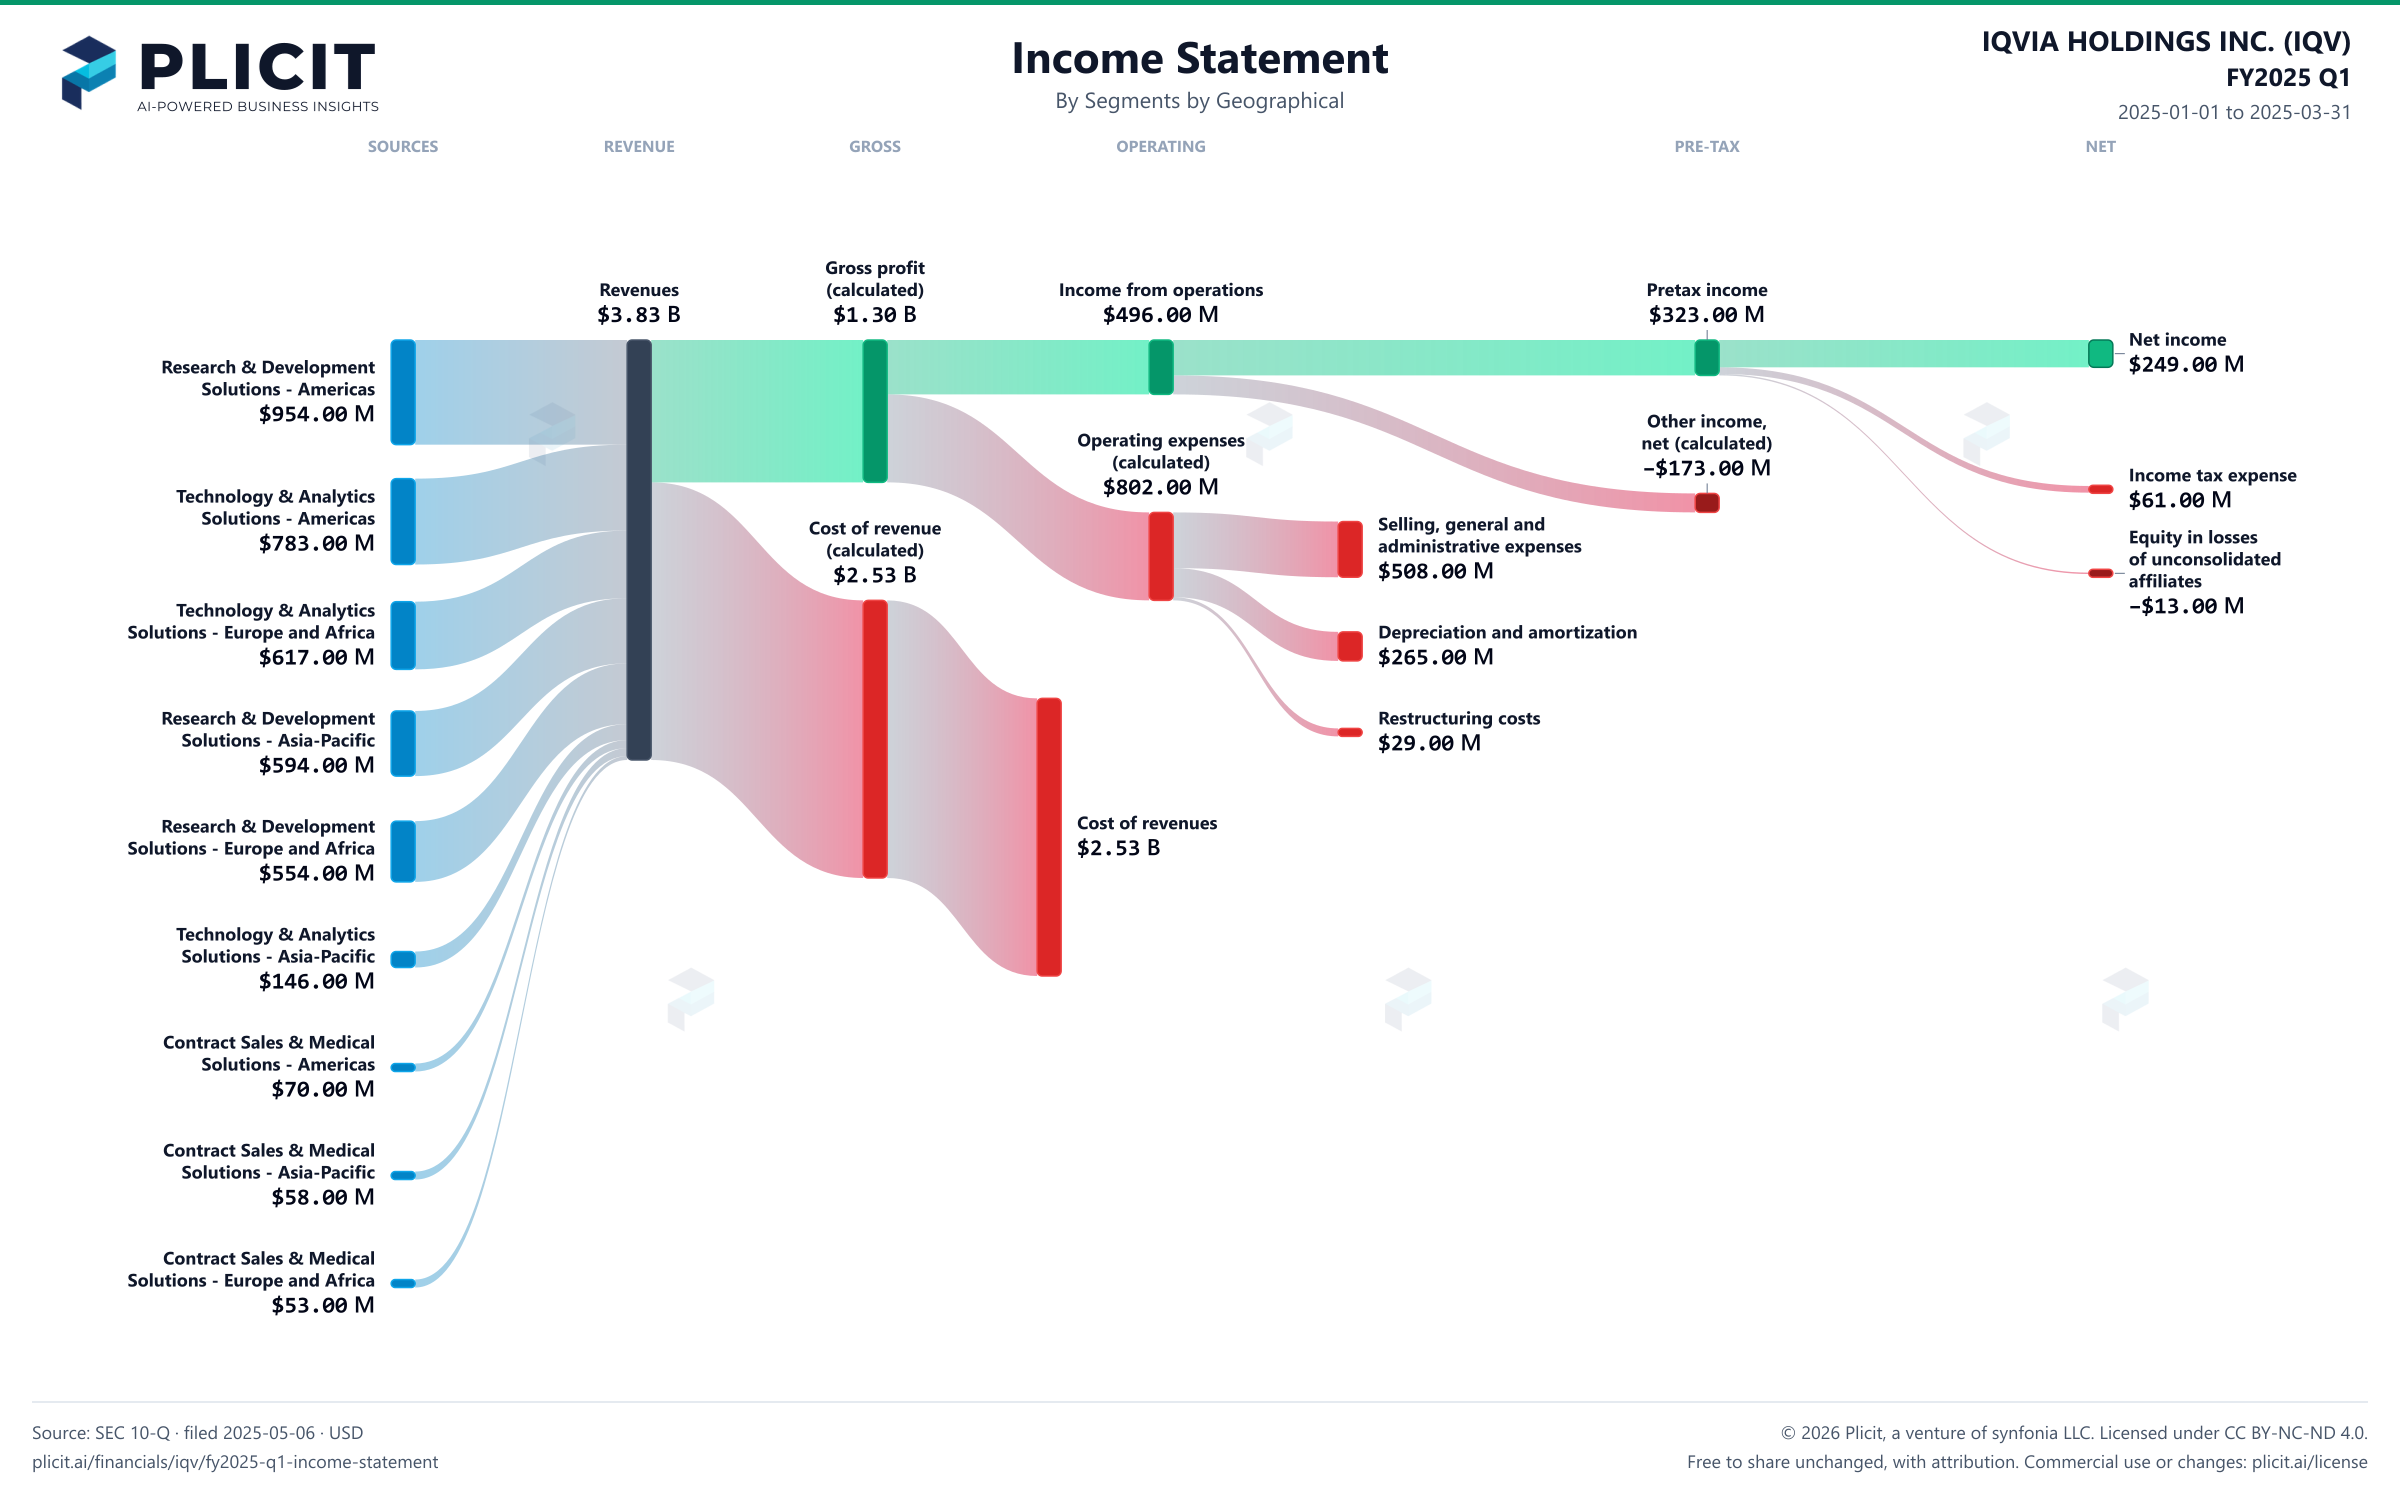
IQVIA HOLDINGS INC. (IQV) FY2025 Q1 P&L / Income Statement Sankey chart, Segments by Geographical view
Free to share unchanged, with credit to Plicit.ai · CC BY-NC-ND 4.0Download PNG

Gross margin

33.9%

Gross profit / revenue

Operating margin

13.0%

Operating profit / revenue

Cash conversion

228.1%

Operating cash / net income, same period

Newsletter

Get the teardowns by email

Subscribe if you want the public-company teardowns in your inbox when they're released.

Product waitlist

Health Check and Teardown for your own company

A health check uncovers insights of your private books, not a public ticker. Join this list to get notified as soon as we go-live!