
Balance Sheet

As of 2024-09-30

Swipe to see the full flow
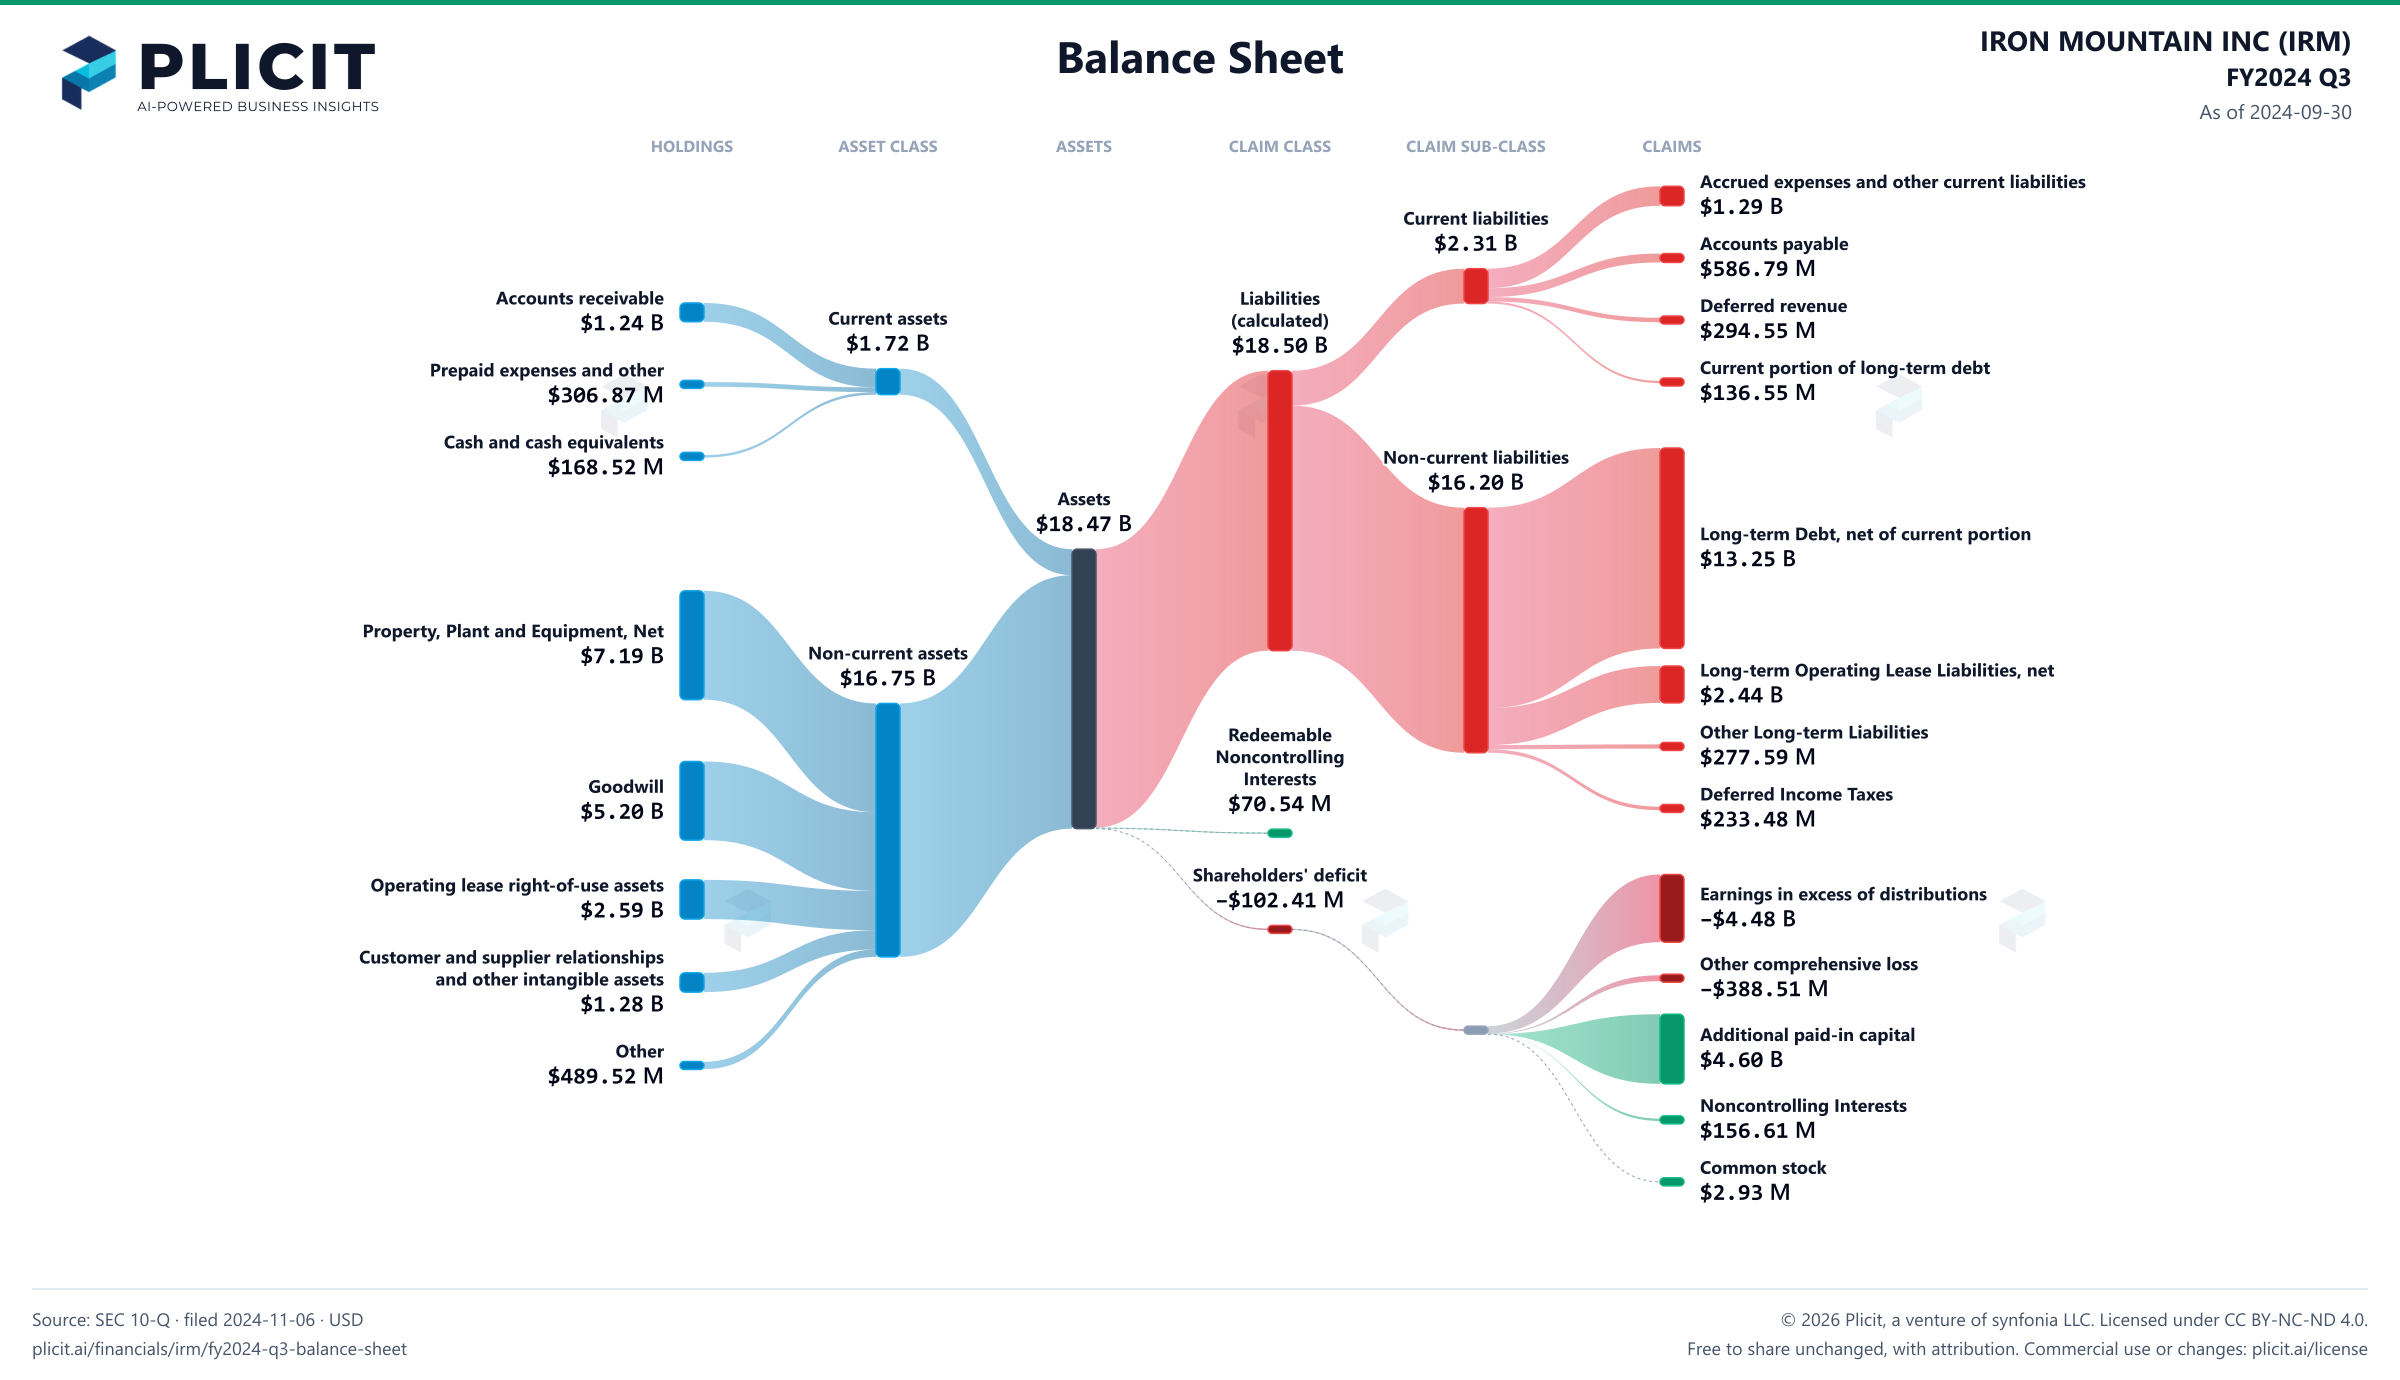
IRON MOUNTAIN INC (IRM) FY2024 Q3 Balance SheetBalance sheet as of 2024-09-30. The chart shows assets, liabilities and equity at that date.Current liabilities$2.31 BLiabilities(calculated)$18.50 BCurrent assets$1.72 BNon-current liabilities$16.20 BAssets$18.47 BNon-current assets$16.75 BRedeemableNoncontrollingInterests$70.54 MShareholders' deficit−$102.41 MHOLDINGSASSET CLASSASSETSCLAIM CLASSCLAIM SUB-CLASSCLAIMSAccounts receivable (less allowances of $84,190 and $74,762 as of September 30, 2024 and December 31, 2023, respectively)Prepaid expenses and otherCash and cash equivalentsProperty, Plant and Equipment, NetGoodwillOperating lease right-of-use assetsCustomer and supplier relationships and other intangible assetsOtherAccrued expenses and other current liabilities (includes current portion of operating lease liabilities)Accounts payableDeferred revenueCurrent portion of long-term debtLong-term Debt, net of current portionLong-term Operating Lease Liabilities, net of current portionOther Long-term LiabilitiesDeferred Income Taxes(Distributions in excess of earnings) Earnings in excess of distributionsAccumulated other comprehensive items, netAdditional paid-in capitalNoncontrolling InterestsCommon stock (par value $0.01; authorized 400,000,000 shares; issued and outstanding 293,425,265 and 292,142,739 shares as of September 30, 2024 and December 31, 2023, respectively)Current assetsNon-current assetsAssetsCurrent liabilitiesNon-current liabilitiesLiabilities (calculated)Redeemable Noncontrolling InterestsShareholders' deficitShareholders' deficitAccrued expenses and other current liabilities (includes current portion of operating lease liabilities)Accrued expenses and other current liabilities$1.29 BCurrent liabilitiesCurrent liabilities$2.31 BAccounts payableAccounts payable$586.79 MAccounts receivable (less allowances of $84,190 and $74,762 as of September 30, 2024 and December 31, 2023, respectively)Accounts receivable$1.24 BLiabilities (calculated)Liabilities(calculated)$18.50 BDeferred revenueDeferred revenue$294.55 MCurrent assetsCurrent assets$1.72 BCurrent portion of long-term debtCurrent portion of long-term debt$136.55 MPrepaid expenses and otherPrepaid expenses and other$306.87 MCash and cash equivalentsCash and cash equivalents$168.52 MNon-current liabilitiesNon-current liabilities$16.20 BAssetsAssets$18.47 BLong-term Debt, net of current portionLong-term Debt, net of current portion$13.25 BProperty, Plant and Equipment, NetProperty, Plant and Equipment, Net$7.19 BNon-current assetsNon-current assets$16.75 BLong-term Operating Lease Liabilities, net of current portionLong-term Operating Lease Liabilities, net$2.44 BOther Long-term LiabilitiesOther Long-term Liabilities$277.59 MRedeemable Noncontrolling InterestsRedeemableNoncontrollingInterests$70.54 MGoodwillGoodwill$5.20 BDeferred Income TaxesDeferred Income Taxes$233.48 MShareholders' deficitShareholders' deficit−$102.41 MOperating lease right-of-use assetsOperating lease right-of-use assets$2.59 B(Distributions in excess of earnings) Earnings in excess of distributionsEarnings in excess of distributions−$4.48 BCustomer and supplier relationships and other intangible assetsCustomer and supplier relationshipsand other intangible assets$1.28 BAccumulated other comprehensive items, netOther comprehensive loss−$388.51 MAdditional paid-in capitalAdditional paid-in capital$4.60 BOtherOther$489.52 MNoncontrolling InterestsNoncontrolling Interests$156.61 MCommon stock (par value $0.01; authorized 400,000,000 shares; issued and outstanding 293,425,265 and 292,142,739 shares as of September 30, 2024 and December 31, 2023, respectively)Common stock$2.93 M
Chart details

IRON MOUNTAIN INC (IRM) FY2024 Q3 Balance Sheet

Balance sheet as of 2024-09-30. The chart shows assets, liabilities and equity at that date.

Assets
18,469,629,000 US dollars
Current assets
1,718,846,000 US dollars
Non-current assets
16,750,783,000 US dollars
Liabilities (calculated)
18,501,500,000 US dollars
Current liabilities
2,306,061,000 US dollars
Non-current liabilities
16,195,439,000 US dollars
Shareholders' deficit
negative 102,408,000 US dollars
Redeemable Noncontrolling Interests
70,537,000 US dollars
Noncontrolling interest
156,605,000 US dollars. Included in consolidated equity; this amount is not added again.
Property, plant and equipment
11,549,081,000 US dollars. Part of Property, Plant and Equipment, Net, drawn as one net amount.
Less—Accumulated depreciation
negative 4,354,477,000 US dollars. Part of Property, Plant and Equipment, Net, drawn as one net amount.
Accounts receivable (less allowances of $84,190 and $74,762 as of September 30, 2024 and December 31, 2023, respectively)
1,243,464,000 US dollars
Prepaid expenses and other
306,867,000 US dollars
Cash and cash equivalents
168,515,000 US dollars
Property, Plant and Equipment, Net
7,194,604,000 US dollars
Goodwill
5,198,460,000 US dollars
Operating lease right-of-use assets
2,591,238,000 US dollars
Customer and supplier relationships and other intangible assets
1,276,963,000 US dollars
Other
489,518,000 US dollars
Accrued expenses and other current liabilities (includes current portion of operating lease liabilities)
1,288,176,000 US dollars
Accounts payable
586,793,000 US dollars
Deferred revenue
294,545,000 US dollars
Current portion of long-term debt
136,547,000 US dollars
Long-term Debt, net of current portion
13,245,462,000 US dollars
Long-term Operating Lease Liabilities, net of current portion
2,438,905,000 US dollars
Other Long-term Liabilities
277,588,000 US dollars
Deferred Income Taxes
233,484,000 US dollars
Additional paid-in capital
4,602,246,000 US dollars
Common stock (par value $0.01; authorized 400,000,000 shares; issued and outstanding 293,425,265 and 292,142,739 shares as of September 30, 2024 and December 31, 2023, respectively)
2,934,000 US dollars
Preferred stock (par value $0.01; authorized 10,000,000 shares; none issued and outstanding)
0 US dollars
Noncontrolling Interests
156,605,000 US dollars
(Distributions in excess of earnings) Earnings in excess of distributions
negative 4,475,682,000 US dollars
Accumulated other comprehensive items, net
negative 388,511,000 US dollars

Chart connections

  • Assets equal liabilities plus temporary equity plus consolidated equity. Consolidated equity includes noncontrolling interests when reported.
  • Treasury shares and other negative equity contributions reduce equity.
IRON MOUNTAIN INC (IRM) FY2024 Q3 Balance Sheet Sankey chart
Free to share unchanged, with credit to Plicit.ai · CC BY-NC-ND 4.0Download PNG

Newsletter

Get the teardowns by email

Subscribe if you want the public-company teardowns in your inbox when they're released.

Product waitlist

Health Check and Teardown for your own company

A health check uncovers insights of your private books, not a public ticker. Join this list to get notified as soon as we go-live!