
J.B. HUNT TRANSPORT SERVICES, INC. (JBHT) FY2026 Q1 Statement of Cash Flows

Published Source: Form 10-Q on SEC EDGAR filed (opens in a new tab)

2026-01-01 to 2026-03-31

Statement of Cash Flows

Swipe to see the full flow
J.B. HUNT TRANSPORT SERVICES, INC. cash flow reconciliation, Jan 1, 2026 through Mar 31, 2026One connected Sankey reconciles operating, investing and financing net cash flows through a shared cash pool, from beginning cash to ending cash. Ribbons flow left to right on one dollar scale. Activity totals are dark gray; beginning and ending cash are blue. Cash basis for beginning and ending balances and net cash change: Cash, cash equivalents, and restricted cash, including disposal groups and discontinued operations. Intermediate calculation bars are lighter gray. Net income is green for profit and red for loss. Identified asset purchases, sales and maturities are blue in either cash direction. Purple identifies capital transactions such as borrowing, repayments, share issuance and dividends. Free cash flow is a separate comparison, not an added cash flow. Read chart description and values below for full signed amounts, including zero items.Net earnings → Net cash from operating activities: $141,553,000.00Depreciation and amortization → Operating adjustments reconciliation: $179,410,000.00Trade accounts payable → Operating adjustments reconciliation: $99,754,000.00Income taxes payable or receivable → Operating adjustments reconciliation: $58,881,000.00Other assets → Operating adjustments reconciliation: $30,443,000.00Noncash lease expense → Operating adjustments reconciliation: $23,803,000.00Share-based compensation → Operating adjustments reconciliation: $18,048,000.00Claims accruals → Operating adjustments reconciliation: $11,113,000.00Loss on sale of revenue equipment and other → Operating adjustments reconciliation: $324,000.00Operating adjustments reconciliation → Net cash from operating activities: $211,485,000.00Operating adjustments reconciliation → Trade accounts receivable: $167,085,000.00Operating adjustments reconciliation → Accrued payroll and other accrued expenses: $23,625,000.00Operating adjustments reconciliation → Deferred income taxes: $19,581,000.00Net proceeds from sale of equipment → investing reconciliation: $39,540,000.00investing reconciliation → Additions to property and equipment: $110,271,000.00Net cash used in financing activities → financing reconciliation: $295,028,000.00Proceeds from revolving lines of credit and other → financing reconciliation: $536,500,000.00Proceeds from issuances of long-term debt → financing reconciliation: $475,000,000.00financing reconciliation → Payments on long-term debt: $700,000,000.00financing reconciliation → Payments on revolving lines of credit and other: $476,200,000.00financing reconciliation → Purchase of treasury stock: $80,063,000.00financing reconciliation → Dividends paid: $42,595,000.00financing reconciliation → Stock repurchased for payroll taxes and other: $7,670,000.00Net cash used in investing activities → investing reconciliation: $70,731,000.00Beginning cash: Cash, cash equivalents, and restricted cash, including disposal groups and discontinued operations → Cash sources and uses: $17,284,000.00Net cash from operating activities → Cash sources and uses: $353,038,000.00Cash sources and uses → Ending cash: Cash, cash equivalents, and restricted cash, including disposal groups and discontinued operations: $4,563,000.00Cash sources and uses → Net cash used in investing activities: $70,731,000.00Cash sources and uses → Net cash used in financing activities: $295,028,000.00Trade accounts payable: $99,754,000.00Accounts payable+$99.75 MDepreciation and amortization: $179,410,000.00Depreciation & amortization+$179.41 MIncome taxes payable or receivable: $58,881,000.00Income tax balances+$58.88 MNoncash lease expense: $23,803,000.00Operating lease amortization+$23.80 MClaims accruals: $11,113,000.00Self-insurance reserves+$11.11 MShare-based compensation: $18,048,000.00Stock-based compensation+$18.05 MAccrued payroll and other accrued expenses: -$23,625,000.00Accrued liabilities−$23.63 MLoss on sale of revenue equipment and other: $324,000.00Asset disposal gain & loss+$324.00 KDeferred income taxes: -$19,581,000.00Deferred income taxes−$19.58 MTrade accounts receivable: -$167,085,000.00Accounts receivable−$167.09 MOther assets: $30,443,000.00Other operating assets+$30.44 MNet earnings: $141,553,000.00Net earnings+$141.55 MNet cash from operating activities: $353,038,000.00Operating cash+$353.04 MOperating adjustments reconciliation: $421,776,000.00Proceeds from issuances of long-term debt: $475,000,000.00Long-term debt issued+$475.00 MPayments on long-term debt: -$700,000,000.00Long-term debt repaid−$700.00 MProceeds from revolving lines of credit and other: $536,500,000.00Credit line borrowings+$536.50 MPayments on revolving lines of credit and other: -$476,200,000.00Credit line repayments−$476.20 MPurchase of treasury stock: -$80,063,000.00Common stock repurchases−$80.06 MStock repurchased for payroll taxes and other: -$7,670,000.00Stock repurchased for payroll taxes and other−$7.67 MDividends paid: -$42,595,000.00Dividends paid−$42.60 MNet cash used in financing activities: -$295,028,000.00. Cash required to fund net payments.Financing cash−$295.03 Mfinancing reconciliation: $1,306,528,000.00Additions to property and equipment: -$110,271,000.00PP&E purchases−$110.27 MNet proceeds from sale of equipment: $39,540,000.00Equipment sales+$39.54 MNet cash used in investing activities: -$70,731,000.00. Cash required to fund net payments.Investing cash−$70.73 Minvesting reconciliation: $110,271,000.00Cash sources and uses: $370,322,000.00Beginning cash: Cash, cash equivalents, and restricted cash, including disposal groups and discontinued operations: $17,284,000.00Beginning cash$17.28 MEnding cash: Cash, cash equivalents, and restricted cash, including disposal groups and discontinued operations: $4,563,000.00Ending cash$4.56 MCASH RECONCILIATIONOperatingflowsInvestingflowsFinancingflowsFree cash flow$242.77 MOperating cash − cash spent on PP&ECash flow / Net income2.49×Operating cash flow ÷ net incomeNet cash change−$12.72 MEnding cash − beginning cash
Chart details

J.B. HUNT TRANSPORT SERVICES, INC. cash flow reconciliation, Jan 1, 2026 through Mar 31, 2026

Cash flows for Jan 1, 2026 through Mar 31, 2026. Cash basis: Cash, cash equivalents, and restricted cash, including disposal groups and discontinued operations. Beginning cash: Dec 31, 2025. Ending cash: Mar 31, 2026. Beginning and ending cash are dated balances. Positive cash flows add cash; negative cash flows reduce it.

Beginning cash on Dec 31, 2025
17,284,000 US dollars. Beginning cash: Cash, cash equivalents, and restricted cash, including disposal groups and discontinued operations
Operating activities
353,038,000 US dollars. Net cash provided.
Net earnings
141,553,000 US dollars
Trade accounts payable
99,754,000 US dollars
Depreciation and amortization
179,410,000 US dollars
Income taxes payable or receivable
58,881,000 US dollars
Noncash lease expense
23,803,000 US dollars
Claims accruals
11,113,000 US dollars
Share-based compensation
18,048,000 US dollars
Accrued payroll and other accrued expenses
negative 23,625,000 US dollars
Loss on sale of revenue equipment and other
324,000 US dollars
Deferred income taxes
negative 19,581,000 US dollars
Trade accounts receivable
negative 167,085,000 US dollars
Other assets
30,443,000 US dollars
Investing activities
negative 70,731,000 US dollars. Net cash used.
Additions to property and equipment
negative 110,271,000 US dollars
Net proceeds from sale of equipment
39,540,000 US dollars
Financing activities
negative 295,028,000 US dollars. Net cash used.
Proceeds from issuances of long-term debt
475,000,000 US dollars
Payments on long-term debt
negative 700,000,000 US dollars
Proceeds from revolving lines of credit and other
536,500,000 US dollars
Payments on revolving lines of credit and other
negative 476,200,000 US dollars
Purchase of treasury stock
negative 80,063,000 US dollars
Stock repurchased for payroll taxes and other
negative 7,670,000 US dollars
Dividends paid
negative 42,595,000 US dollars
Operating adjustment reconciliation
421,776,000 US dollars. Intermediate calculation joining the operating reconciliation branches. Its gross amount includes any portion of net income routed through this junction. It is not an additional cash source or use.
financing gross reconciliation
1,306,528,000 US dollars. Gross amount at the activity's junction before offsetting its receipts and deductions. It is not an additional cash source or use.
investing gross reconciliation
110,271,000 US dollars. Gross amount at the activity's junction before offsetting its receipts and deductions. It is not an additional cash source or use.
Exchange-rate effect
0 US dollars
Ending cash on Mar 31, 2026
4,563,000 US dollars. Ending cash: Cash, cash equivalents, and restricted cash, including disposal groups and discontinued operations
Cash sources and uses
370,322,000 US dollars. Opening cash plus net sources, equal to net uses plus ending cash.
Net cash change
negative 12,721,000 US dollars. Ending cash minus beginning cash.
Cash flow / Net income
2.49×. Operating cash flow divided by reconciliation net income for the same period. Black from 0.90× through 1.10×; green above 1.10×; red below 0.90×. Color uses the unrounded ratio.
Operating cash flow
353,038,000 US dollars. Operating cash flow used in the free cash flow calculation.
Cash purchases of property, plant and equipment
110,271,000 US dollars. These cash purchases are already included in investing activities above.
Free cash flow
242,767,000 US dollars. A supplemental measure; finance-lease payments are excluded from this definition.

Chart connections

  • Beginning cash plus operating, investing and financing cash flows plus the exchange-rate effect equals ending cash. Negative amounts reduce cash.
  • Financing contributions meet at a reconciliation junction before connecting to the net cash total.
  • Investing contributions meet at a reconciliation junction before connecting to the net cash total.
  • Operating reconciliation adjustments are not all independent cash receipts.
  • Net income enters operating cash directly in the reconciliation. The adjustment junction contributes the remaining $211.49M after reconciling the other positive and negative adjustments. These connections depict an accounting reconciliation, not traced cash receipts.
  • Each activity has one net cash bar connected to the shared cash pool. Positive activity totals enter the pool; negative activity totals leave the pool to fund that activity's net payments. The central pool does not assign a particular funding source to a particular payment.
  • The intermediate calculation bars include both sides of the displayed activity breakdowns; they are not additional cash flows.
  • Operating cash flow minus cash purchases of property, plant and equipment equals free cash flow: 353,038,000 US dollars minus 110,271,000 US dollars equals 242,767,000 US dollars.
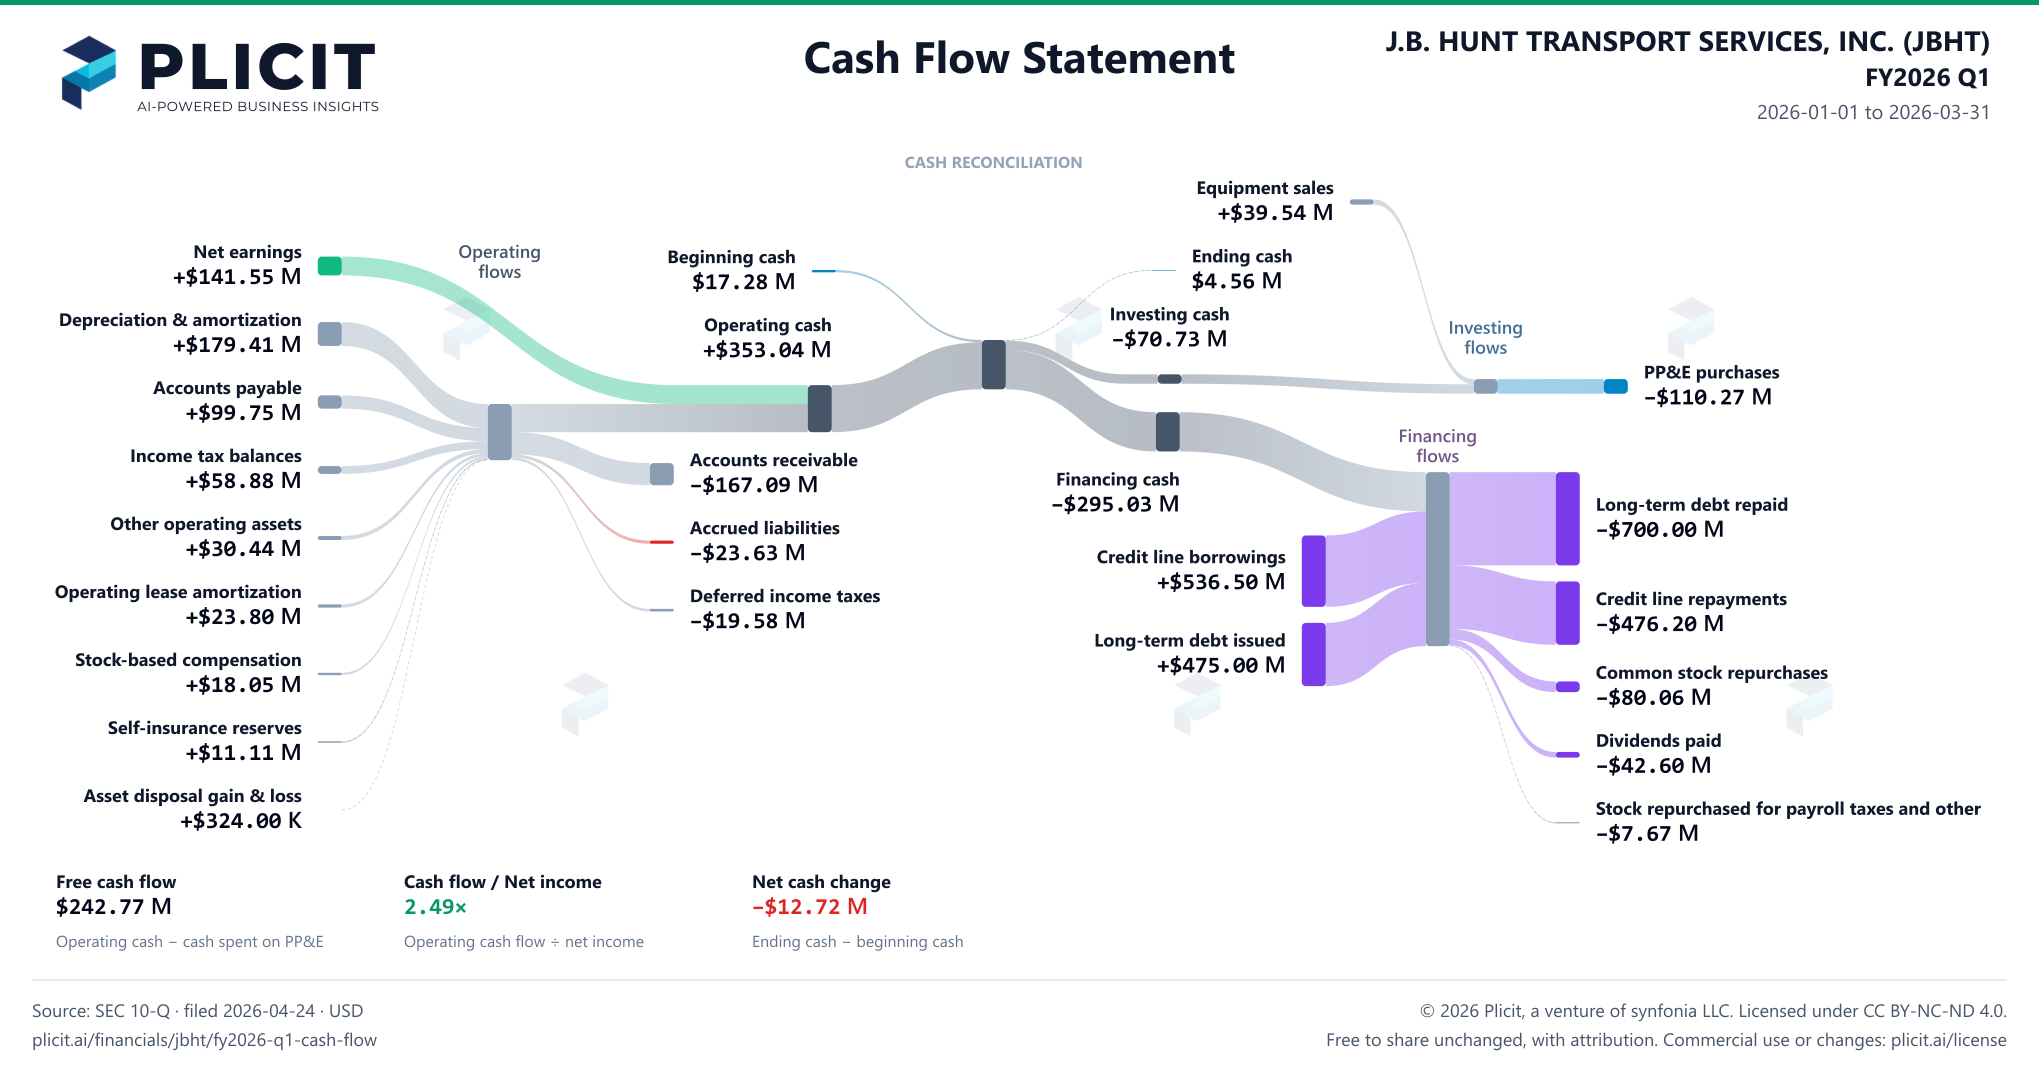
J.B. HUNT TRANSPORT SERVICES, INC. (JBHT) FY2026 Q1 Statement of Cash Flows Sankey chart
Free to share unchanged, with credit to Plicit.ai · CC BY-NC-ND 4.0Download PNG

Product waitlist

Health Check and Teardown for your own company

A health check uncovers insights of your private books, not a public ticker. Join this list to get notified as soon as we go-live!