
JABIL INC (JBL) FY2026 Q2 Balance Sheet

Published Source: Form 10-Q on SEC EDGAR filed (opens in a new tab)

As of 2026-02-28

Balance Sheet

Swipe to see the full flow
JABIL INC (JBL) FY2026 Q2 Balance SheetBalance sheet as of 2026-02-28. The chart shows assets, liabilities and equity at that date.Current liabilities$14.81 BCurrent assets$15.01 BLiabilities$19.28 BAssets$20.63 BNon-current liabilities$4.47 BNon-current assets$5.62 BEquity$1.35 BHOLDINGSASSET CLASSASSETSCLAIM CLASSCLAIM SUB-CLASSCLAIMSInventories, net of reserve for excess and obsolete inventoryAccounts receivable, net of allowance for credit lossesPrepaid expenses and other current assetsCash and cash equivalentsContract assetsProperty, plant and equipment, net of accumulated depreciation of $5,071 as of February 28, 2026, and $4,970 as of August 31, 2025GoodwillIntangible assets, net of accumulated amortizationOperating lease right-of-use assetsOther assetsDeferred income taxesAccounts payableAccrued expensesCurrent installments of notes payable and long-term debtCurrent operating lease liabilitiesNotes payable and long-term debt, less current installmentsNon-current operating lease liabilitiesOther liabilitiesDeferred income taxesIncome tax liabilitiesRetained earningsAdditional paid-in capitalNoncontrolling interestsTreasury stock at cost, 173,586,335 and 170,611,165 shares as of February 28, 2026 and August 31, 2025, respectivelyCurrent assetsNon-current assetsAssetsCurrent liabilitiesNon-current liabilitiesLiabilitiesEquityEquityCurrent liabilitiesCurrent liabilities$14.81 BAccounts payableAccounts payable$8.52 BInventories, net of reserve for excess and obsolete inventoryInventories, net$4.97 BCurrent assetsCurrent assets$15.01 BLiabilitiesLiabilities$19.28 BAccrued expensesAccrued expenses$5.70 BAccounts receivable, net of allowance for credit lossesAccounts receivable, net of allowance for credit losses$4.39 BCurrent installments of notes payable and long-term debtCurrent installments of notespayable and long-term debt$500.00 MPrepaid expenses and other current assetsPrepaid expenses and other current assets$2.55 BCurrent operating lease liabilitiesCurrent operating lease liabilities$99.00 MAssetsAssets$20.63 BCash and cash equivalentsCash and cash equivalents$1.83 BNotes payable and long-term debt, less current installmentsNotes payable and long-term debt, net$3.38 BContract assetsContract assets$1.27 BNon-current liabilitiesNon-current liabilities$4.47 BNon-current operating lease liabilitiesNon-current operating lease liabilities$414.00 MOther liabilitiesOther liabilities$405.00 MProperty, plant and equipment, net of accumulated depreciation of $5,071 as of February 28, 2026, and $4,970 as of August 31, 2025Property, plant and equipment, net$2.84 BDeferred income taxesDeferred income taxes$142.00 MGoodwillGoodwill$1.23 BIncome tax liabilitiesIncome tax liabilities$131.00 MNon-current assetsNon-current assets$5.62 BIntangible assets, net of accumulated amortizationIntangible assets, net of accumulated amortization$648.00 MEquityEquity$1.35 BRetained earningsRetained earnings$6.73 BOperating lease right-of-use assetsOperating lease right-of-use assets$487.00 MAdditional paid-in capitalAdditional paid-in capital$3.15 BOther assetsOther assets$268.00 MNoncontrolling interestsNoncontrolling interests$5.00 MDeferred income taxesDeferred income taxes$147.00 MTreasury stock at cost, 173,586,335 and 170,611,165 shares as of February 28, 2026 and August 31, 2025, respectivelyBought back (treasury stock)−$8.54 B
Chart details

JABIL INC (JBL) FY2026 Q2 Balance Sheet

Balance sheet as of 2026-02-28. The chart shows assets, liabilities and equity at that date.

Assets
20,628,000,000 US dollars
Current assets
15,009,000,000 US dollars
Non-current assets
5,619,000,000 US dollars
Liabilities
19,279,000,000 US dollars
Current liabilities
14,811,000,000 US dollars
Non-current liabilities
4,468,000,000 US dollars
Equity
1,349,000,000 US dollars
Noncontrolling interest
5,000,000 US dollars. Included in consolidated equity; this amount is not added again.
Inventories, net of reserve for excess and obsolete inventory
4,972,000,000 US dollars
Accounts receivable, net of allowance for credit losses
4,390,000,000 US dollars
Prepaid expenses and other current assets
2,547,000,000 US dollars
Cash and cash equivalents
1,830,000,000 US dollars
Contract assets
1,270,000,000 US dollars
Property, plant and equipment, net of accumulated depreciation of $5,071 as of February 28, 2026, and $4,970 as of August 31, 2025
2,840,000,000 US dollars
Goodwill
1,229,000,000 US dollars
Intangible assets, net of accumulated amortization
648,000,000 US dollars
Operating lease right-of-use assets
487,000,000 US dollars
Other assets
268,000,000 US dollars
Deferred income taxes
147,000,000 US dollars
Accounts payable
8,517,000,000 US dollars
Accrued expenses
5,695,000,000 US dollars
Current installments of notes payable and long-term debt
500,000,000 US dollars
Current operating lease liabilities
99,000,000 US dollars
Notes payable and long-term debt, less current installments
3,376,000,000 US dollars
Non-current operating lease liabilities
414,000,000 US dollars
Other liabilities
405,000,000 US dollars
Deferred income taxes
142,000,000 US dollars
Income tax liabilities
131,000,000 US dollars
Retained earnings
6,733,000,000 US dollars
Additional paid-in capital
3,149,000,000 US dollars
Preferred stock, $0.001 par value, authorized 10,000,000 shares; no shares issued and no shares outstanding
0 US dollars
Common stock, $0.001 par value, authorized 500,000,000 shares; 279,404,569 and 278,092,060 shares issued and 105,818,234 and 107,480,895 shares outstanding as of February 28, 2026 and August 31, 2025, respectively
0 US dollars
Accumulated other comprehensive loss
0 US dollars
Noncontrolling interests
5,000,000 US dollars
Treasury stock at cost, 173,586,335 and 170,611,165 shares as of February 28, 2026 and August 31, 2025, respectively
negative 8,538,000,000 US dollars

Chart connections

  • Assets equal liabilities plus consolidated equity. Consolidated equity includes noncontrolling interests when reported.
  • Treasury shares and other negative equity contributions reduce equity.
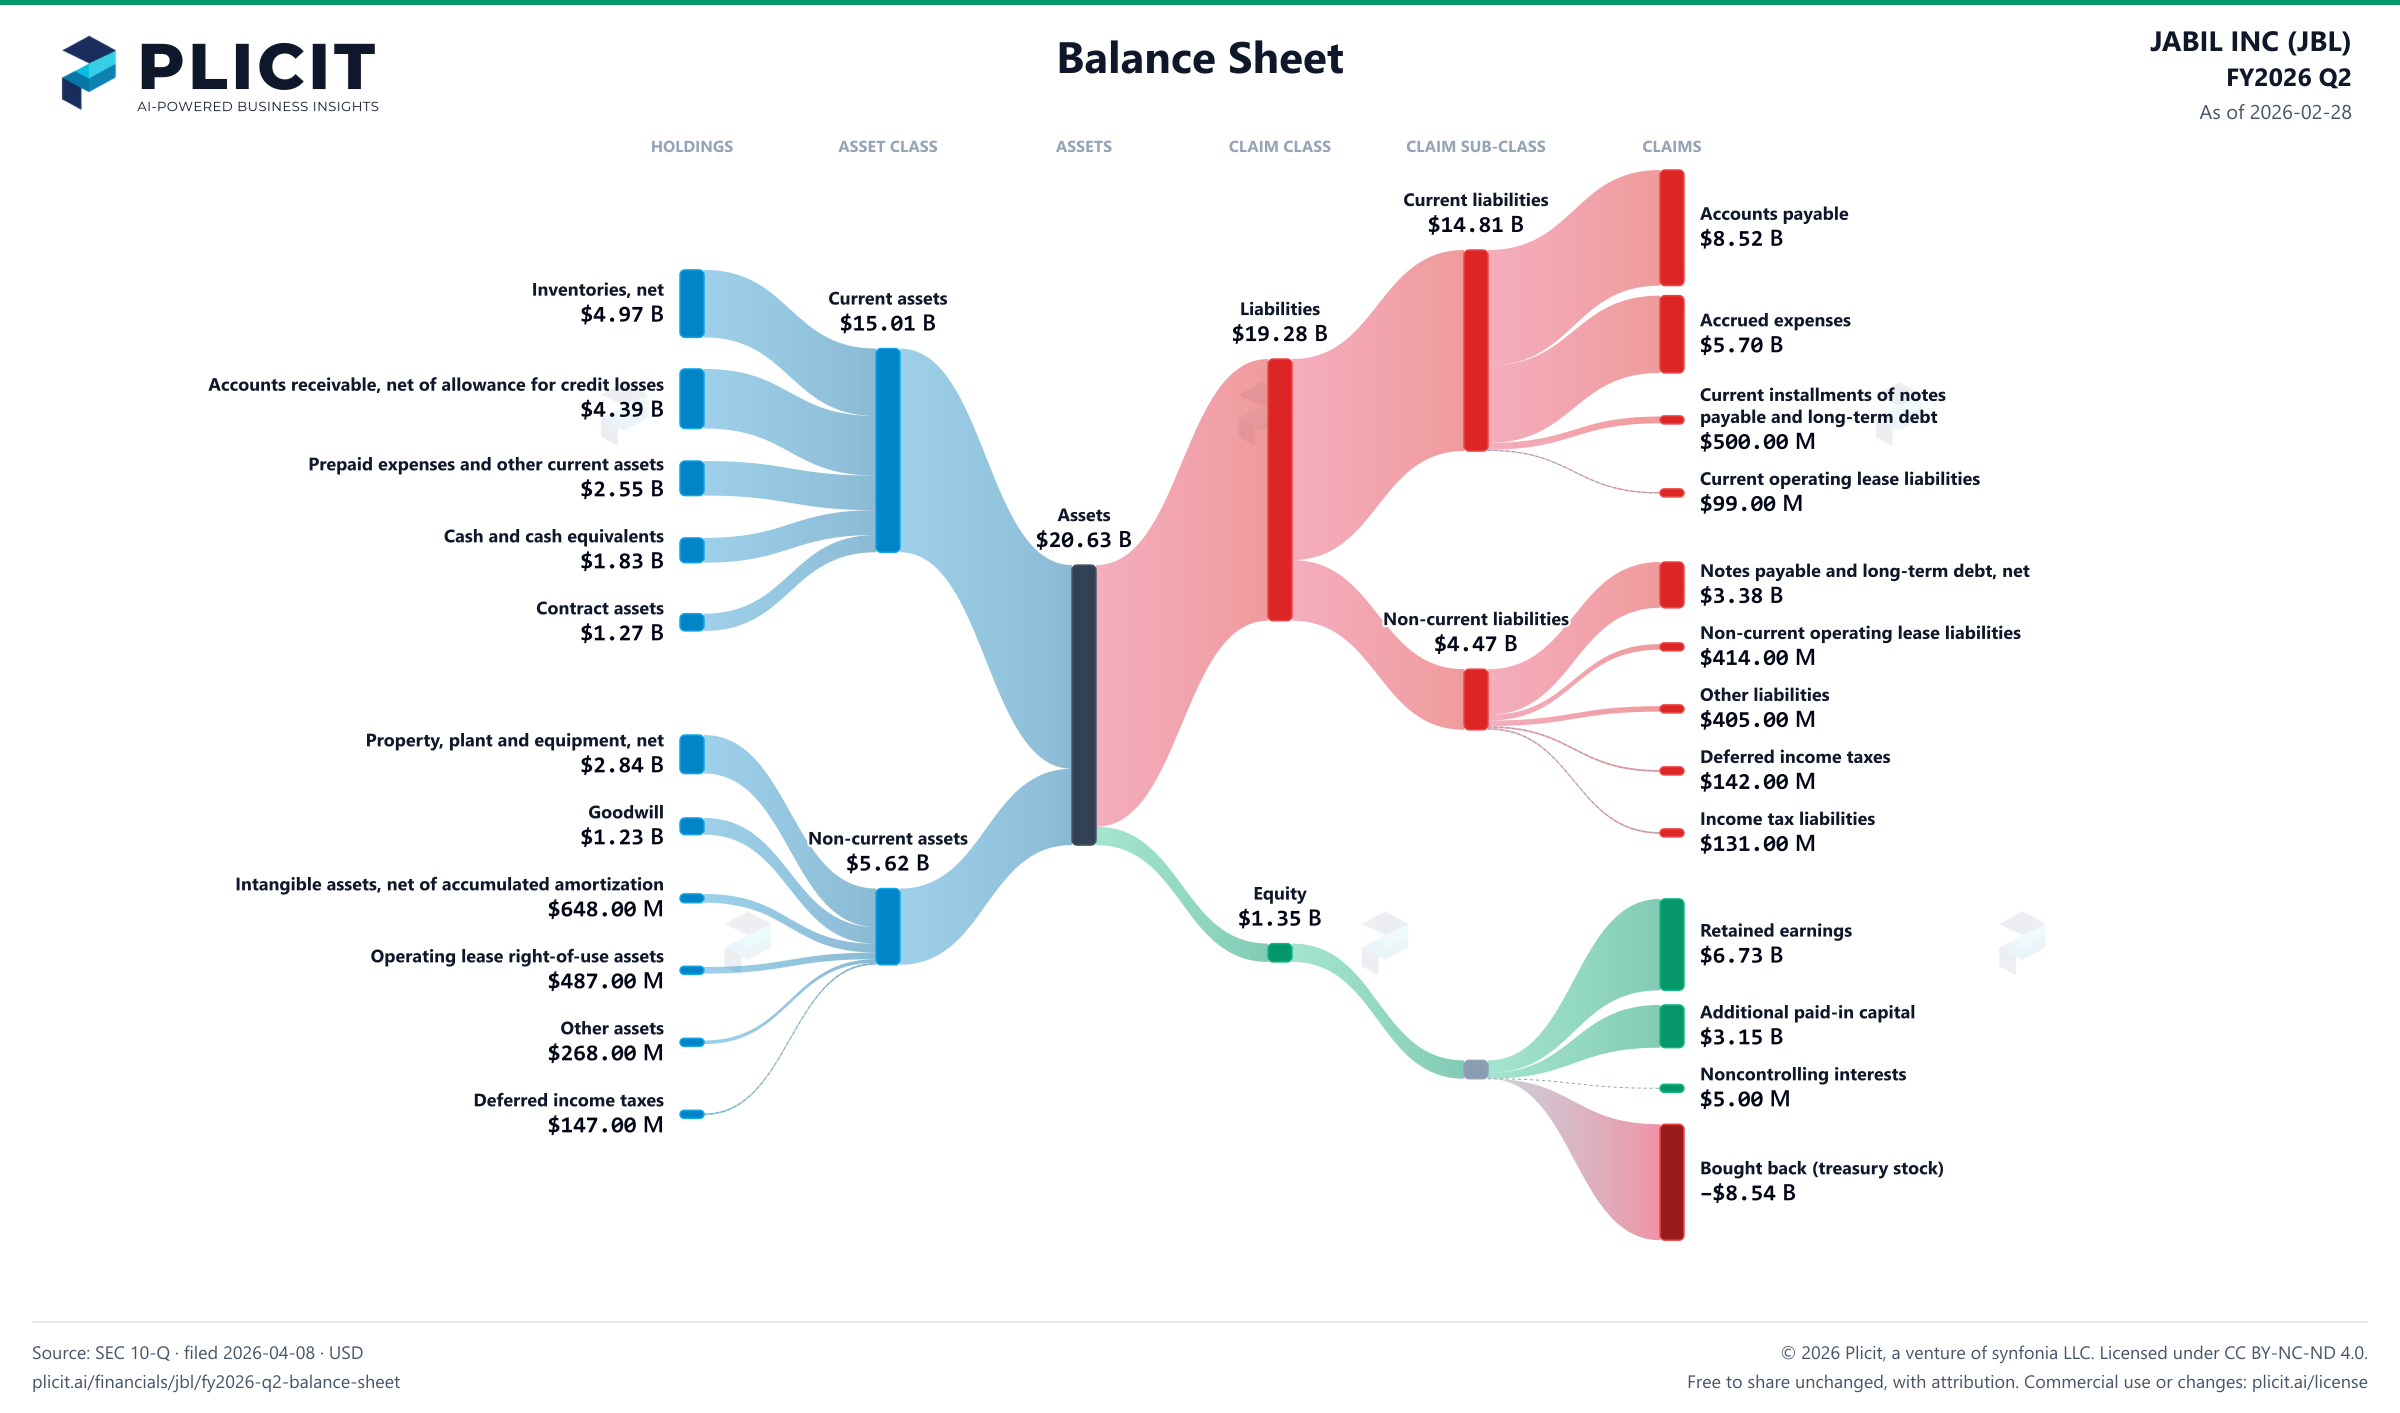
JABIL INC (JBL) FY2026 Q2 Balance Sheet Sankey chart
Free to share unchanged, with credit to Plicit.ai · CC BY-NC-ND 4.0Download PNG

Product waitlist

Health Check and Teardown for your own company

A health check uncovers insights of your private books, not a public ticker. Join this list to get notified as soon as we go-live!