
Jefferies Financial Group Inc. (JEF) FY2026 Q3 Balance Sheet
As of 2026-08-31
Balance Sheet
As of 2026-08-31
Swipe to see the full flow
Chart details
Jefferies Financial Group Inc. (JEF) FY2026 Q3 Balance Sheet
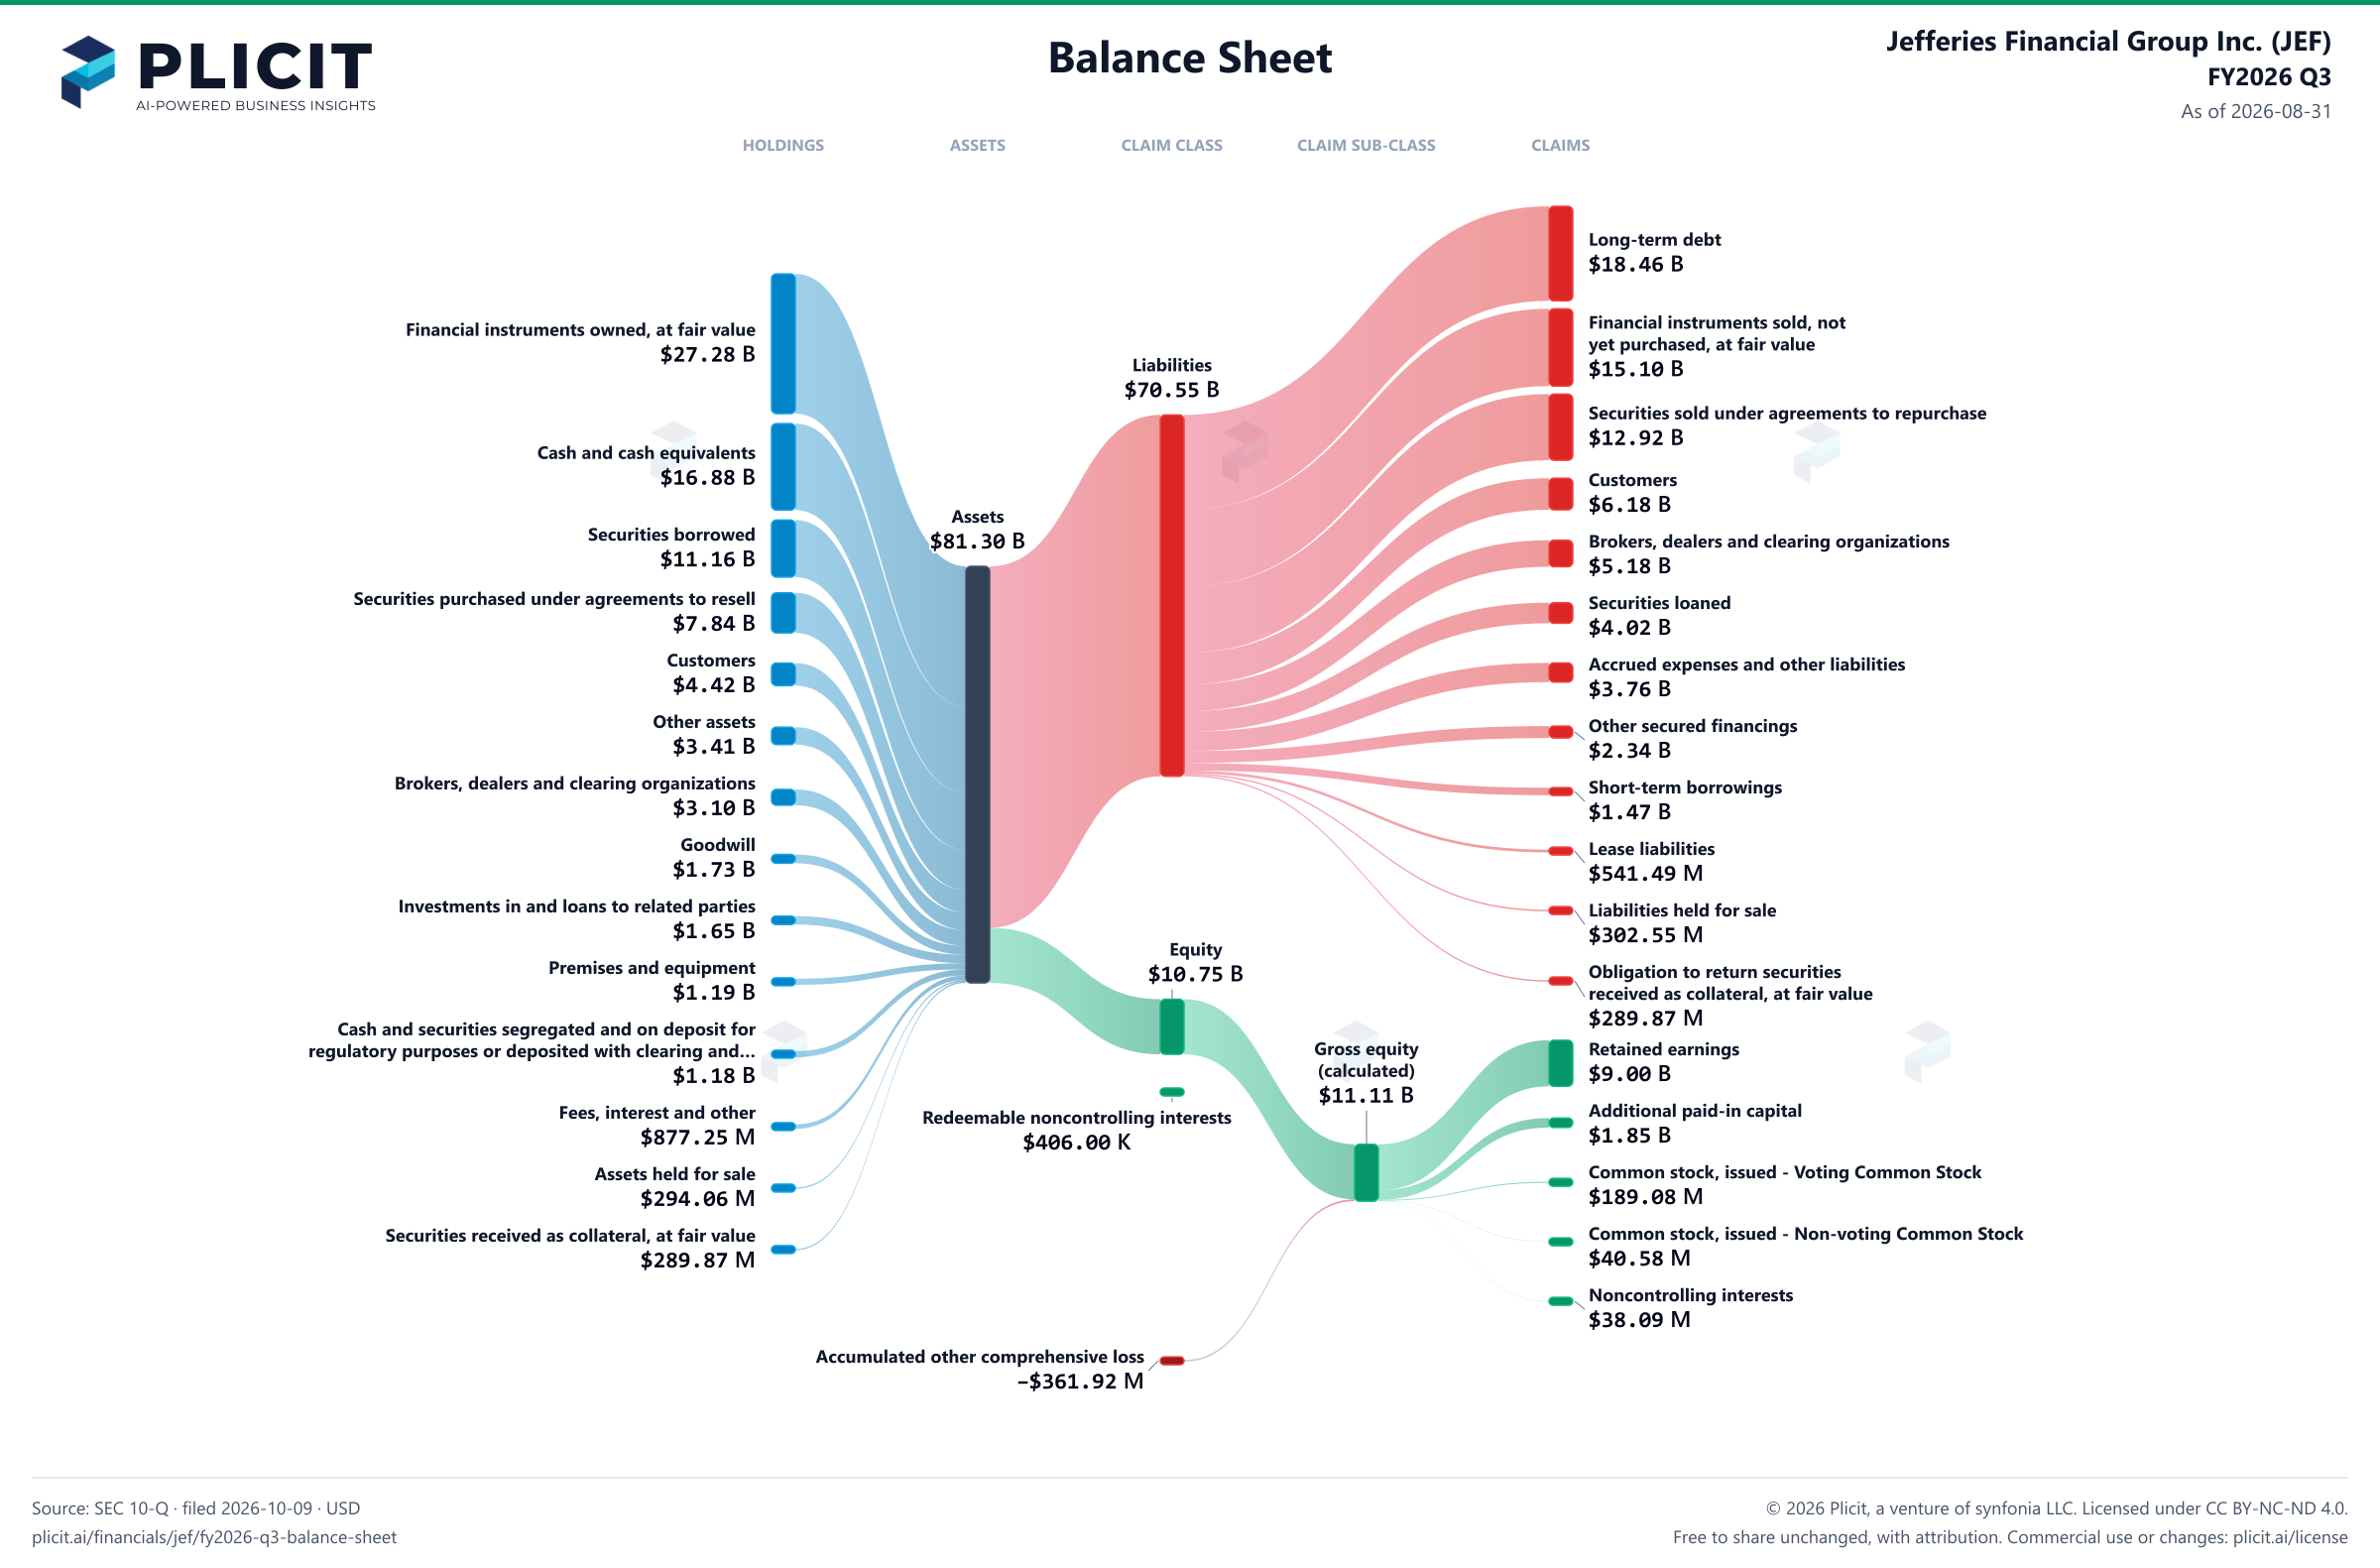
Balance sheet as of 2026-08-31. The chart shows assets, liabilities and equity at that date.
- Assets
- 81,301,858,000 US dollars
- Liabilities
- 70,549,008,000 US dollars
- Equity
- 10,752,444,000 US dollars
- Redeemable noncontrolling interests
- 406,000 US dollars
- Noncontrolling interest
- 38,090,000 US dollars. Included in consolidated equity; this amount is not added again.
- Financial instruments owned, at fair value (includes securities pledged of $17,552,721 and $17,419,373)
- 27,282,633,000 US dollars
- Cash and cash equivalents
- 16,883,584,000 US dollars
- Securities borrowed
- 11,158,355,000 US dollars
- Securities purchased under agreements to resell
- 7,840,742,000 US dollars
- Customers
- 4,416,818,000 US dollars
- Other assets (includes assets pledged of $675,462 and $627,259)
- 3,412,045,000 US dollars
- Brokers, dealers and clearing organizations
- 3,096,144,000 US dollars
- Goodwill
- 1,726,023,000 US dollars
- Investments in and loans to related parties
- 1,653,340,000 US dollars
- Premises and equipment
- 1,193,043,000 US dollars
- Cash and securities segregated and on deposit for regulatory purposes or deposited with clearing and depository organizations
- 1,177,954,000 US dollars
- Fees, interest and other
- 877,248,000 US dollars
- Assets held for sale
- 294,060,000 US dollars
- Securities received as collateral, at fair value
- 289,869,000 US dollars
- Long-term debt (includes $3,941,920 and $3,734,843 at fair value)
- 18,458,995,000 US dollars
- Financial instruments sold, not yet purchased, at fair value
- 15,095,989,000 US dollars
- Securities sold under agreements to repurchase
- 12,920,669,000 US dollars
- Customers
- 6,175,387,000 US dollars
- Brokers, dealers and clearing organizations
- 5,182,459,000 US dollars
- Securities loaned
- 4,023,003,000 US dollars
- Accrued expenses and other liabilities
- 3,756,749,000 US dollars
- Other secured financings (includes $413,121 and $425,964 at fair value)
- 2,336,070,000 US dollars
- Short-term borrowings
- 1,465,781,000 US dollars
- Lease liabilities
- 541,486,000 US dollars
- Liabilities held for sale
- 302,551,000 US dollars
- Obligation to return securities received as collateral, at fair value
- 289,869,000 US dollars
- Retained earnings
- 8,996,409,000 US dollars
- Additional paid-in capital
- 1,850,209,000 US dollars
- Common stock, issued - Voting Common Stock
- 189,079,000 US dollars
- Common stock, issued - Non-voting Common Stock
- 40,579,000 US dollars
- Series B preferred shares, par value of $1 per share, authorized 70,000 shares; 0 and 55,125 shares issued and outstanding - Series B Preferred Stock
- 0 US dollars
- Noncontrolling interests
- 38,090,000 US dollars
- Accumulated other comprehensive loss
- negative 361,922,000 US dollars
- Gross equity (calculated)
- 11,114,366,000 US dollars. Net equity plus the magnitudes of its negative contributions equals gross positive equity. The negative contributions enter this reconciliation as add-backs; their filed signs stay negative.
Chart connections
- Assets equal liabilities plus temporary equity plus consolidated equity. Consolidated equity includes noncontrolling interests when reported.
- Treasury shares and other negative equity contributions reduce equity.
Free to share unchanged, with credit to Plicit.ai · CC BY-NC-ND 4.0Download PNG
Product waitlist
Health Check and Teardown for your own company
A health check uncovers insights of your private books, not a public ticker. Join this list to get notified as soon as we go-live!