
The St. Joe Company (JOE) FY2026 Q2 Balance Sheet

Balance Sheet

As of 2026-06-30

Swipe to see the full flow
The St. Joe Company (JOE) FY2026 Q2 Balance SheetBalance sheet as of 2026-06-30. The chart shows assets, liabilities and equity at that date.Liabilities$735.38 MAssets$1.51 BEquity$772.97 MGross equity(calculated)$811.40 MHOLDINGSASSETSCLAIM CLASSCLAIM SUB-CLASSCLAIMSInvestment in real estate, netInvestments held by special purpose entitiesCash and cash equivalentsOther assetsInvestment in unconsolidated joint venturesProperty and equipment, net of accumulated depreciation of $112,969 and $105,175 as of June 30, 2026 and December 31, 2025, respectivelyDebt, netSenior Notes held by special purpose entityAccounts payable and other liabilitiesDeferred revenueDeferred tax liabilities, netRetained earningsCommon stock, no par value; 180,000,000 shares authorized; 57,572,323 and 57,547,307 issued at June 30, 2026 and December 31, 2025, respectively; and 56,991,651 and 57,547,307 outstanding at June 30, 2026 and December 31, 2025, respectivelyAccumulated other comprehensive incomeNon-controlling interestAssetsLiabilitiesEquityGross equity (calculated)Treasury stock at cost, 580,672 shares held at June 30, 2026LiabilitiesLiabilities$735.38 MDebt, netDebt, net$370.32 MAssetsAssets$1.51 BSenior Notes held by special purpose entitySenior Notes held by special purpose entity$179.00 MAccounts payable and other liabilitiesAccounts payable and other liabilities$63.69 MInvestment in real estate, netInvestment in real estate, net$990.78 MDeferred revenueDeferred revenue$62.37 MEquityEquity$772.97 MDeferred tax liabilities, netDeferred tax liabilities, net$60.00 MGross equity (calculated)Gross equity(calculated)$811.40 MInvestments held by special purpose entitiesInvestments held by special purpose entities$202.42 MCash and cash equivalentsCash and cash equivalents$117.32 MRetained earningsRetained earnings$572.26 MOther assetsOther assets$91.58 MInvestment in unconsolidated joint venturesInvestment in unconsolidated joint ventures$70.27 MCommon stock, no par value; 180,000,000 shares authorized; 57,572,323 and 57,547,307 issued at June 30, 2026 and December 31, 2025, respectively; and 56,991,651 and 57,547,307 outstanding at June 30, 2026 and December 31, 2025, respectivelyCommon stock, no par value$230.18 MProperty and equipment, net of accumulated depreciation of $112,969 and $105,175 as of June 30, 2026 and December 31, 2025, respectivelyProperty and equipment, net$35.98 MAccumulated other comprehensive incomeAccumulated other comprehensive income$463.00 KNon-controlling interestNon-controlling interest$8.51 MTreasury stock at cost, 580,672 shares held at June 30, 2026Treasury stock at cost−$38.44 M
Chart details

The St. Joe Company (JOE) FY2026 Q2 Balance Sheet

Balance sheet as of 2026-06-30. The chart shows assets, liabilities and equity at that date.

Assets
1,508,347,000 US dollars
Liabilities
735,380,000 US dollars
Equity
772,967,000 US dollars
Noncontrolling interest
8,506,000 US dollars. Included in consolidated equity; this amount is not added again.
Investment in real estate, net
990,775,000 US dollars
Investments held by special purpose entities
202,421,000 US dollars
Cash and cash equivalents
117,315,000 US dollars
Other assets
91,581,000 US dollars
Investment in unconsolidated joint ventures
70,274,000 US dollars
Property and equipment, net of accumulated depreciation of $112,969 and $105,175 as of June 30, 2026 and December 31, 2025, respectively
35,981,000 US dollars
Debt, net
370,324,000 US dollars
Senior Notes held by special purpose entity
178,996,000 US dollars
Accounts payable and other liabilities
63,687,000 US dollars
Deferred revenue
62,370,000 US dollars
Deferred tax liabilities, net
60,003,000 US dollars
Retained earnings
572,259,000 US dollars
Common stock, no par value; 180,000,000 shares authorized; 57,572,323 and 57,547,307 issued at June 30, 2026 and December 31, 2025, respectively; and 56,991,651 and 57,547,307 outstanding at June 30, 2026 and December 31, 2025, respectively
230,176,000 US dollars
Accumulated other comprehensive income
463,000 US dollars
Non-controlling interest
8,506,000 US dollars
Treasury stock at cost, 580,672 shares held at June 30, 2026
negative 38,437,000 US dollars
Gross equity (calculated)
811,404,000 US dollars. Net equity plus the magnitudes of its negative contributions equals gross positive equity. The negative contributions enter this reconciliation as add-backs; their filed signs stay negative.

Chart connections

  • Assets equal liabilities plus consolidated equity. Consolidated equity includes noncontrolling interests when reported.
  • Treasury shares and other negative equity contributions reduce equity.
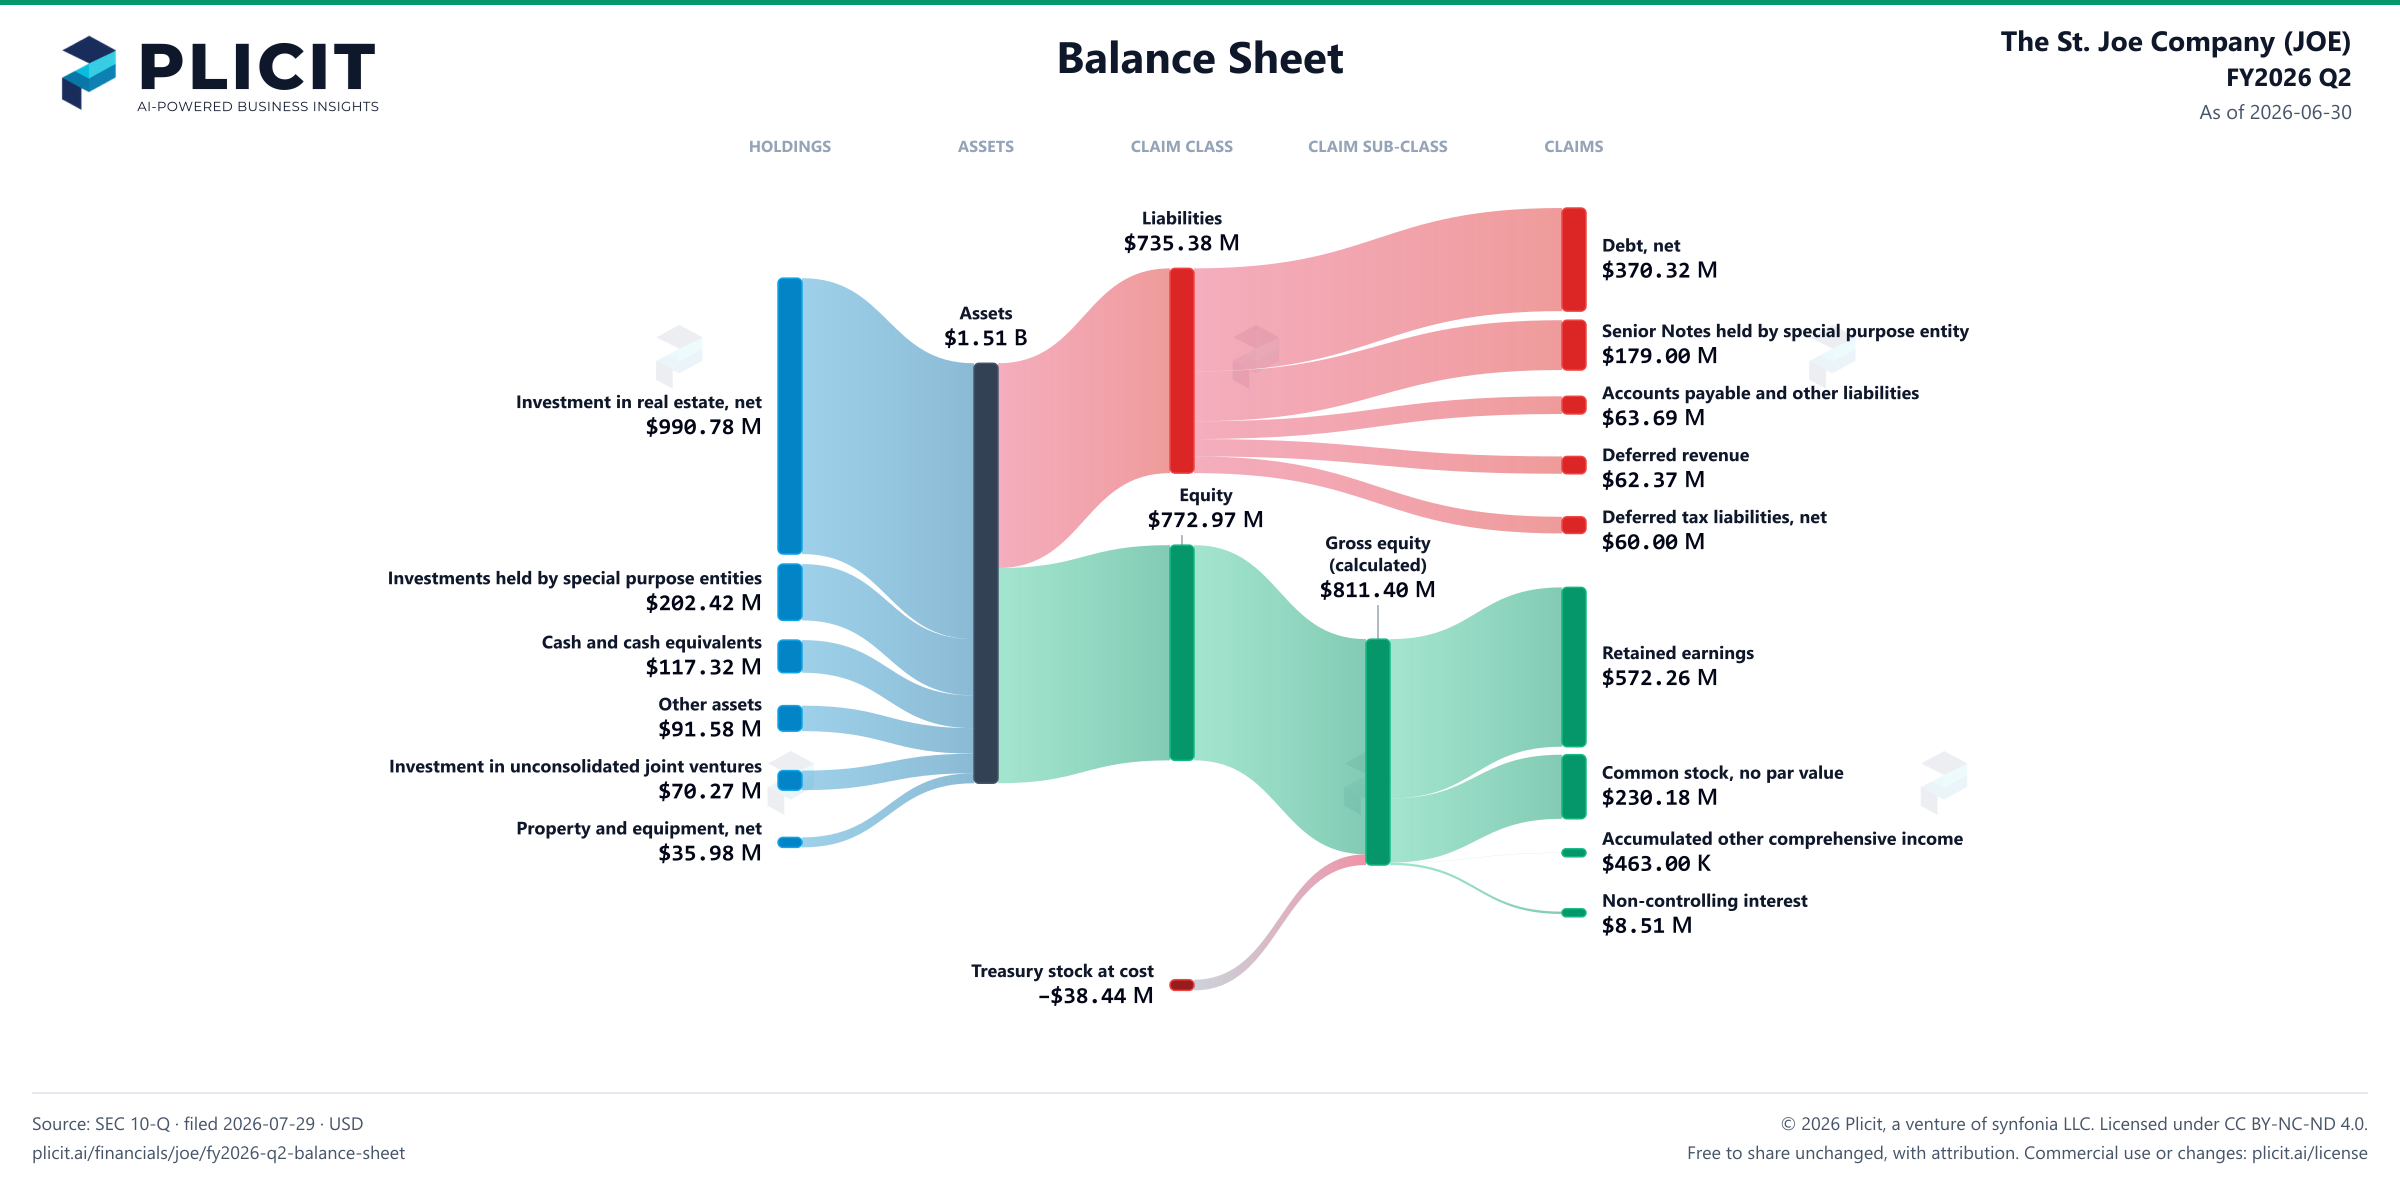
The St. Joe Company (JOE) FY2026 Q2 Balance Sheet Sankey chart
Free to share unchanged, with credit to Plicit.ai · CC BY-NC-ND 4.0Download PNG

Newsletter

Get the teardowns by email

Subscribe if you want the public-company teardowns in your inbox when they're released.

Product waitlist

Health Check and Teardown for your own company

A health check uncovers insights of your private books, not a public ticker. Join this list to get notified as soon as we go-live!