
KBR, Inc. (KBR) FY2026 Q2 Balance Sheet
As of 2026-07-03
Balance Sheet
As of 2026-07-03
Swipe to see the full flow
Chart details
KBR, Inc. (KBR) FY2026 Q2 Balance Sheet
Balance sheet as of 2026-07-03. The chart shows assets, liabilities and equity at that date.
- Assets
- 6,667,000,000 US dollars
- Current assets
- 1,978,000,000 US dollars
- Non-current assets
- 4,689,000,000 US dollars
- Liabilities
- 5,025,000,000 US dollars
- Current liabilities
- 1,723,000,000 US dollars
- Non-current liabilities
- 3,302,000,000 US dollars
- Equity
- 1,642,000,000 US dollars
- Noncontrolling interest
- 6,000,000 US dollars. Included in consolidated equity; this amount is not added again.
- Accounts receivable, net of allowance for credit losses of $5 and $6, respectively
- 1,109,000,000 US dollars
- Contract assets
- 360,000,000 US dollars
- Cash and cash equivalents
- 312,000,000 US dollars
- Other current assets
- 182,000,000 US dollars
- Current assets of discontinued operations
- 15,000,000 US dollars
- Goodwill
- 2,668,000,000 US dollars
- Intangible assets, net of accumulated amortization of $526 and $501, respectively
- 694,000,000 US dollars
- Other assets (including $50 and $0 of available-for-sale debt securities at fair value, respectively)
- 398,000,000 US dollars
- Equity in and advances to unconsolidated affiliates
- 241,000,000 US dollars
- Property, plant and equipment, net of accumulated depreciation of $510 and $506 (including net PPE of $5 and $5 owned by a variable interest entity), respectively
- 227,000,000 US dollars
- Operating lease right-of-use assets
- 224,000,000 US dollars
- Deferred income taxes
- 124,000,000 US dollars
- Pension assets
- 113,000,000 US dollars
- Accounts payable
- 749,000,000 US dollars
- Contract liabilities
- 360,000,000 US dollars
- Accrued salaries, wages and benefits
- 313,000,000 US dollars
- Other current liabilities
- 236,000,000 US dollars
- Current maturities of long-term debt
- 49,000,000 US dollars
- Current liabilities of discontinued operations
- 16,000,000 US dollars
- Long-term debt
- 2,503,000,000 US dollars
- Operating lease liabilities
- 246,000,000 US dollars
- Other liabilities
- 220,000,000 US dollars
- Employee compensation and benefits
- 149,000,000 US dollars
- Income tax payable
- 97,000,000 US dollars
- Deferred income taxes
- 87,000,000 US dollars
- PIC
- 2,566,000,000 US dollars
- Retained earnings
- 1,853,000,000 US dollars
- Preferred stock, $0.001 par value, 50,000,000 shares authorized, none issued
- 0 US dollars
- Common stock, $0.001 par value 300,000,000 shares authorized, 183,154,727 and 182,891,428 shares issued, and 126,067,755 and 126,454,289 shares outstanding, respectively
- 0 US dollars
- Noncontrolling interests
- 6,000,000 US dollars
- Treasury stock, 57,086,972 shares and 56,437,139 shares, at cost, respectively
- negative 1,842,000,000 US dollars
- AOCL
- negative 941,000,000 US dollars
- Gross equity (calculated)
- 4,425,000,000 US dollars. Net equity plus the magnitudes of its negative contributions equals gross positive equity. The negative contributions enter this reconciliation as add-backs; their filed signs stay negative.
Chart connections
- Assets equal liabilities plus consolidated equity. Consolidated equity includes noncontrolling interests when reported.
- Treasury shares and other negative equity contributions reduce equity.
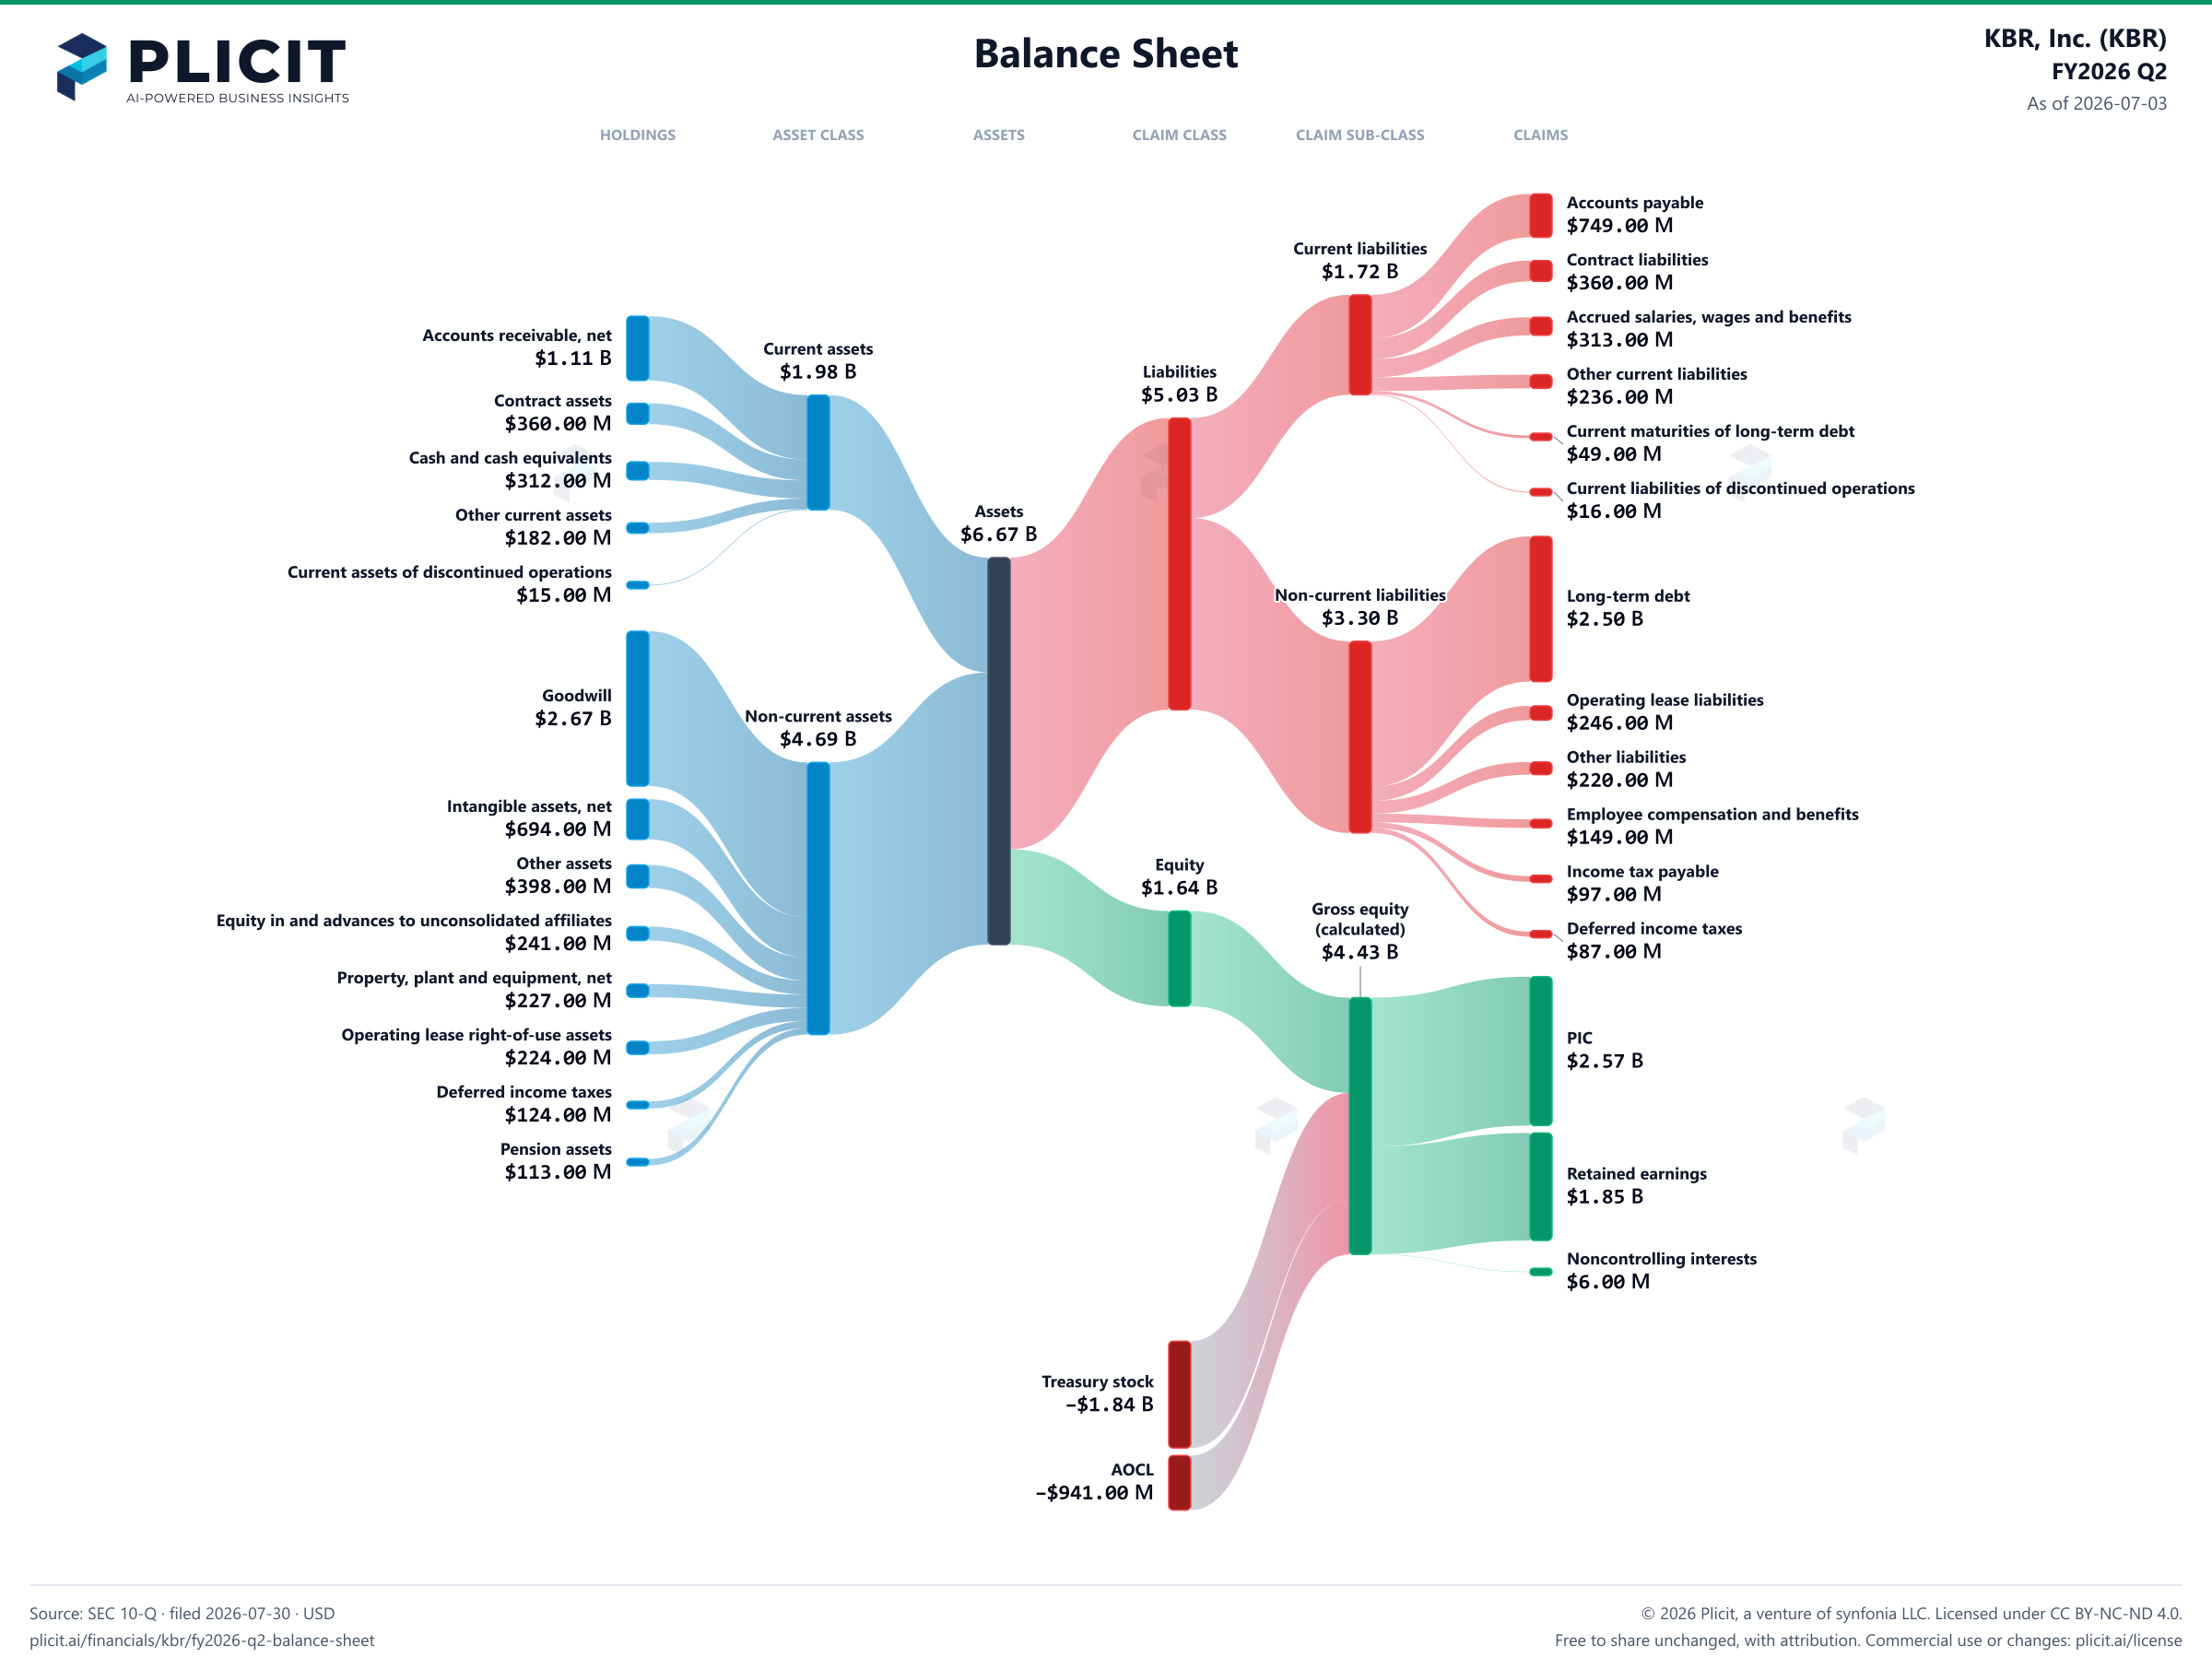
Free to share unchanged, with credit to Plicit.ai · CC BY-NC-ND 4.0Download PNG
Product waitlist
Health Check and Teardown for your own company
A health check uncovers insights of your private books, not a public ticker. Join this list to get notified as soon as we go-live!